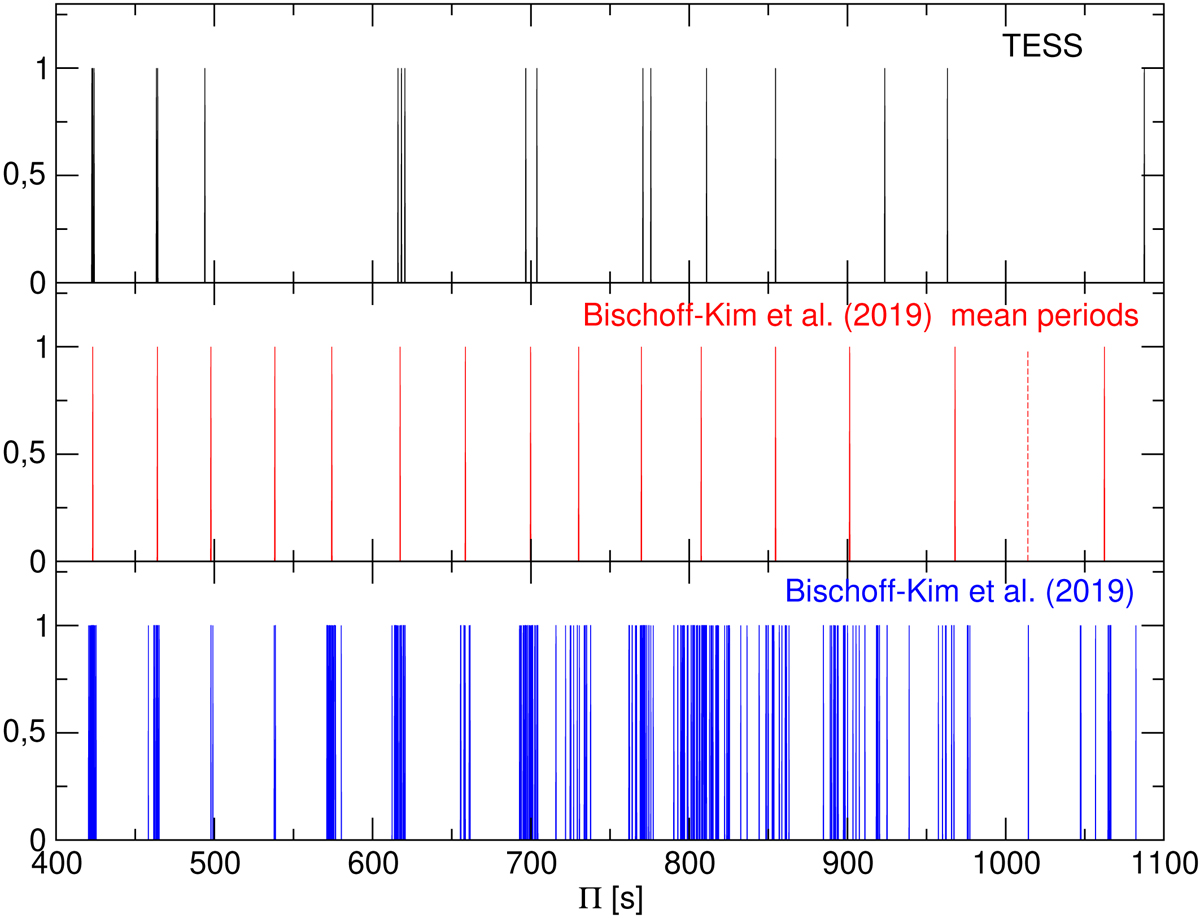
Fig. 4.
Download original image
Illustrative distribution of the periods of GD 358 according to TESS (19 periods, black lines, upper panel), and according to Bischoff-Kim et al. (2019) (15 mean periods, red lines, middle panel, and 352 periods, blue lines, lower panel). The period at 1014.35 s in the middle panel, represented with a red-dashed line, corresponds to a single detection in the 2016 ground-based observations. The amplitudes have been arbitrarily set to one for clarity.
Current usage metrics show cumulative count of Article Views (full-text article views including HTML views, PDF and ePub downloads, according to the available data) and Abstracts Views on Vision4Press platform.
Data correspond to usage on the plateform after 2015. The current usage metrics is available 48-96 hours after online publication and is updated daily on week days.
Initial download of the metrics may take a while.