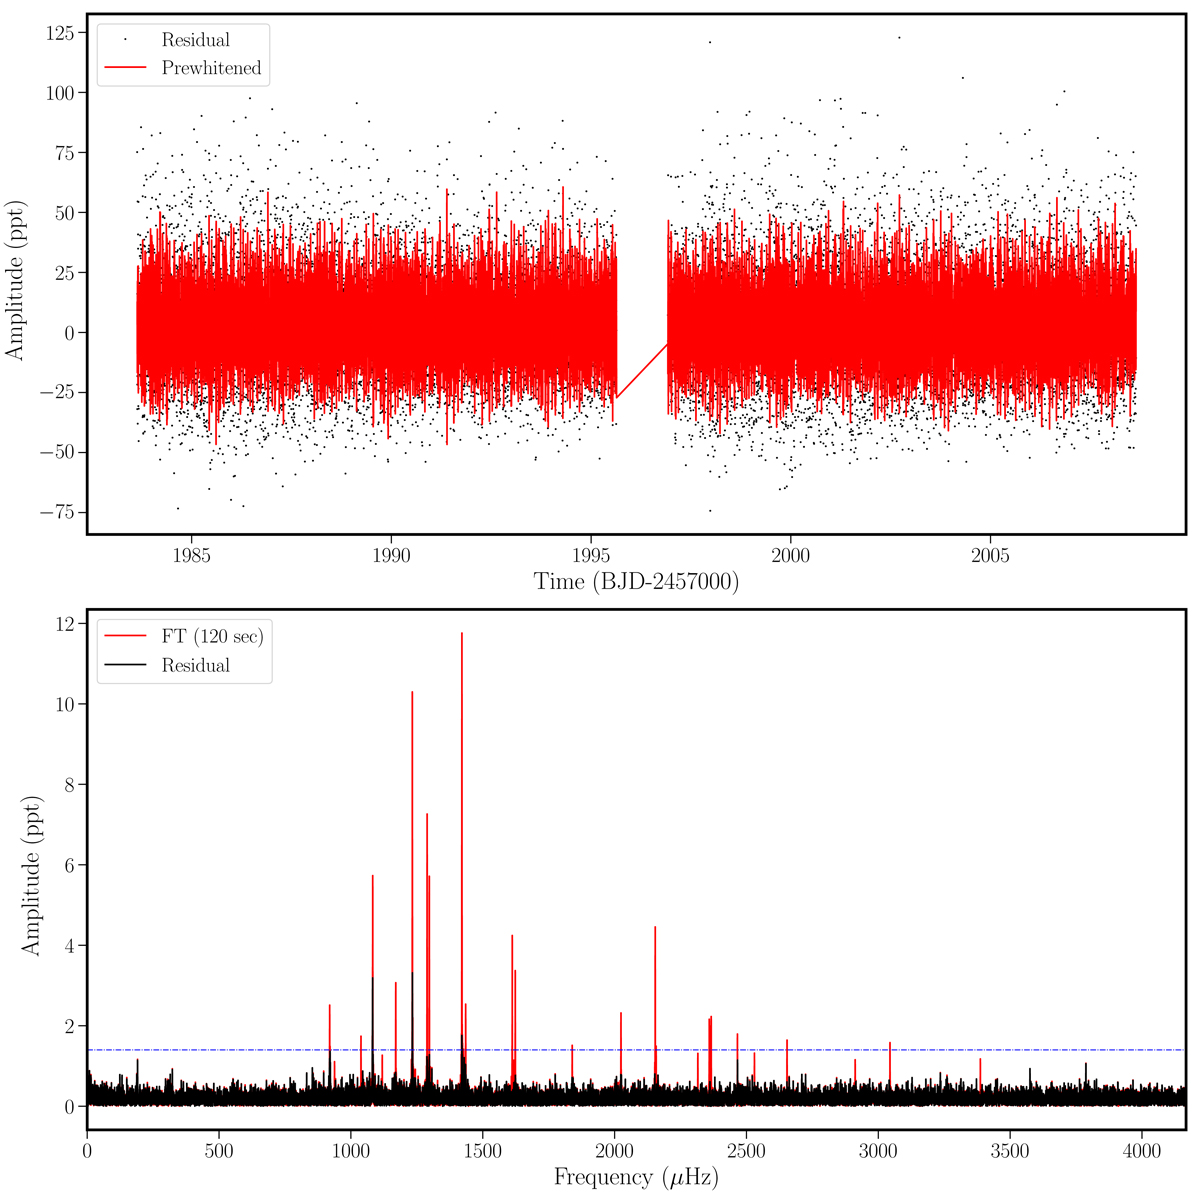
Fig. 2.
Download original image
Top: light curve of the pulsating DBV star GD 358 observed in sector 25. The black dots show the residual flux, while the red lines show all prewhitened variations from the light curve. Bottom: fourier transform of the pulsating DBV star GD 358 observed with 120-sec cadence. The dotted horizontal blue line indicates the 0.1% false-alarm-probability (FAP) significance threshold. The black line is the FT of the prewhitened light curve.
Current usage metrics show cumulative count of Article Views (full-text article views including HTML views, PDF and ePub downloads, according to the available data) and Abstracts Views on Vision4Press platform.
Data correspond to usage on the plateform after 2015. The current usage metrics is available 48-96 hours after online publication and is updated daily on week days.
Initial download of the metrics may take a while.