Fig. 9.
Download original image
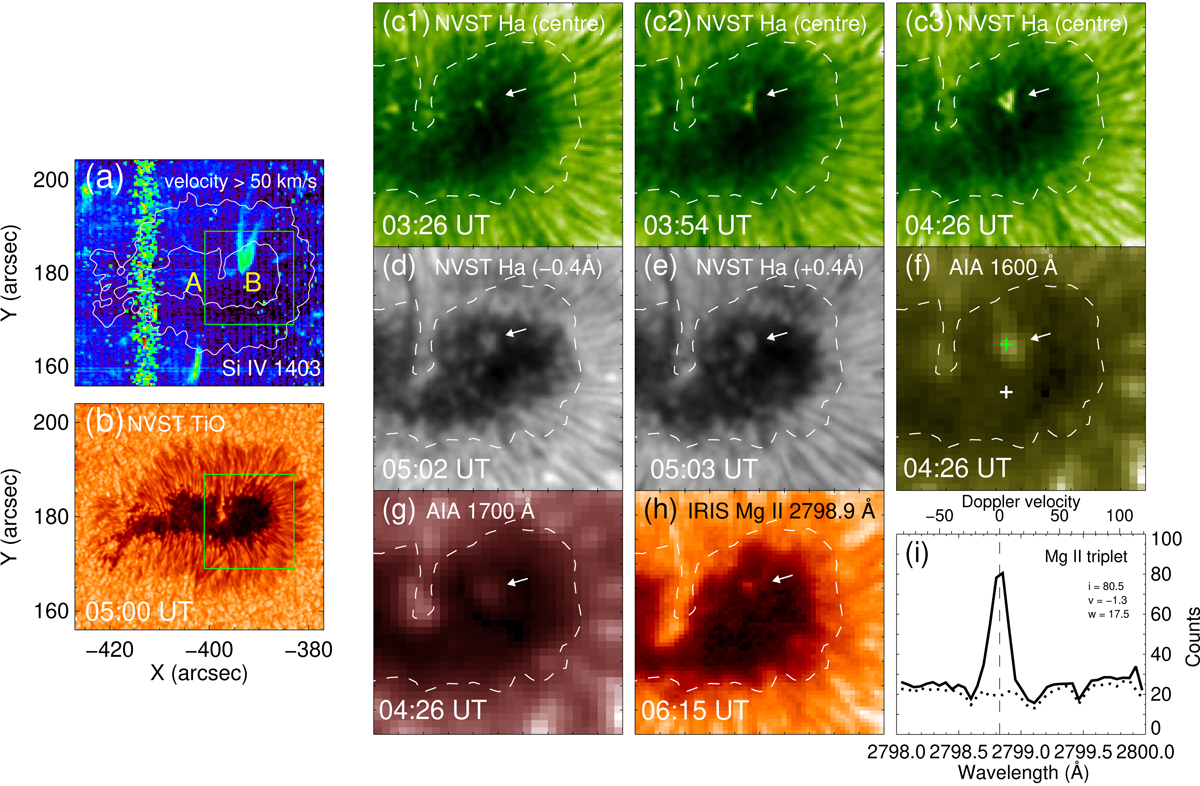
Enhanced localized heating of the chromosphere induced by sunspot supersonic downflows in region B. (a) IRIS Si IV downflow intensity map. (b) NVST TiO image. The green boxes indicate the FOV of the snapshots in the right part. (c) NVST Hα image sequence. (d) NVST Hα blue wing image. (e) NVST Hα red wing image. (f) AIA 1600 Å image. (g) AIA 1700 Å image. (h) Intensity map at the wavelength of 2798.90 Å. The white dashed line marks the outer boundary of the sunspot umbra. The white arrows mark the bright dot induced by downflows. (i) Solid and dashed curves represent spectral profiles of Mg II 2798.809 Å averaged over nine pixels around the green and white plus signs shown in panel f, respectively. The line parameters, including the peak intensity (i), Doppler shift (v), and line width (w) are also given for the Mg II triplet.
Current usage metrics show cumulative count of Article Views (full-text article views including HTML views, PDF and ePub downloads, according to the available data) and Abstracts Views on Vision4Press platform.
Data correspond to usage on the plateform after 2015. The current usage metrics is available 48-96 hours after online publication and is updated daily on week days.
Initial download of the metrics may take a while.