Fig. 8.
Download original image
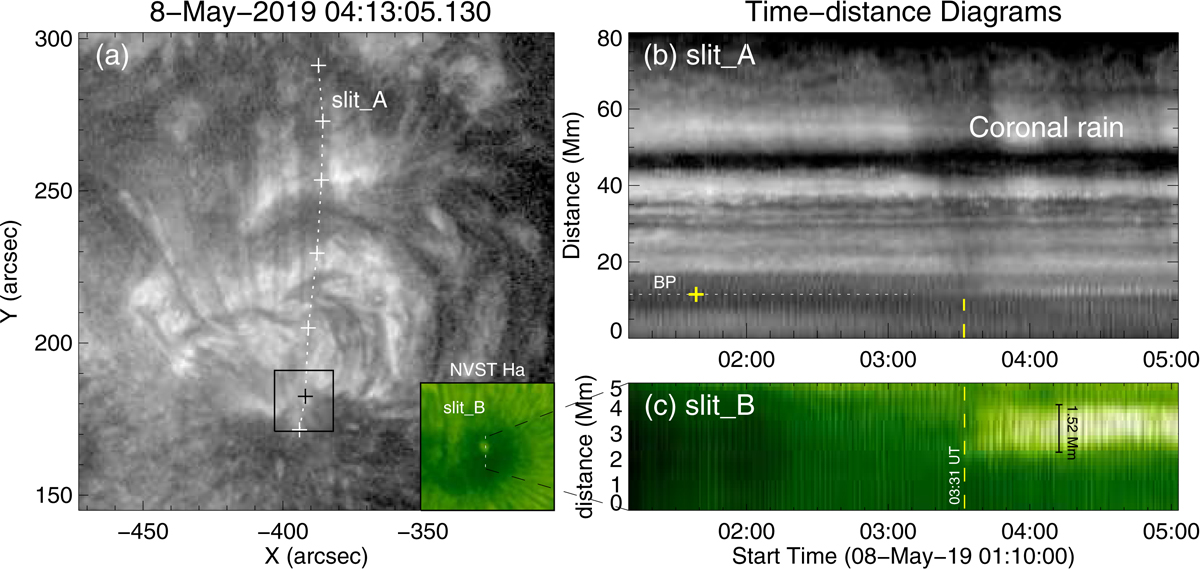
Causal relationship between enhanced localized heating of the chromosphere and coronal rain flows in region B. (a) AIA 304 Å image. At its right bottom corner, an NVST Hα image shows the enhanced localized heating of the chromosphere in a sunspot. (b) Space-time diagram of AIA 304 Å intensity for the “Slit A” trajectory shown in panel a. (c) Space-time diagram of NVST Hα intensity for the “Slit B” trajectory shown in the Hα image in panel a. The yellow vertical dashed lines in panels b and c represent the start time (03:31 UT) of the bright dot appearance. The yellow plus signs in panels a and b denote the position of the bright dot.
Current usage metrics show cumulative count of Article Views (full-text article views including HTML views, PDF and ePub downloads, according to the available data) and Abstracts Views on Vision4Press platform.
Data correspond to usage on the plateform after 2015. The current usage metrics is available 48-96 hours after online publication and is updated daily on week days.
Initial download of the metrics may take a while.