Fig. 7.
Download original image
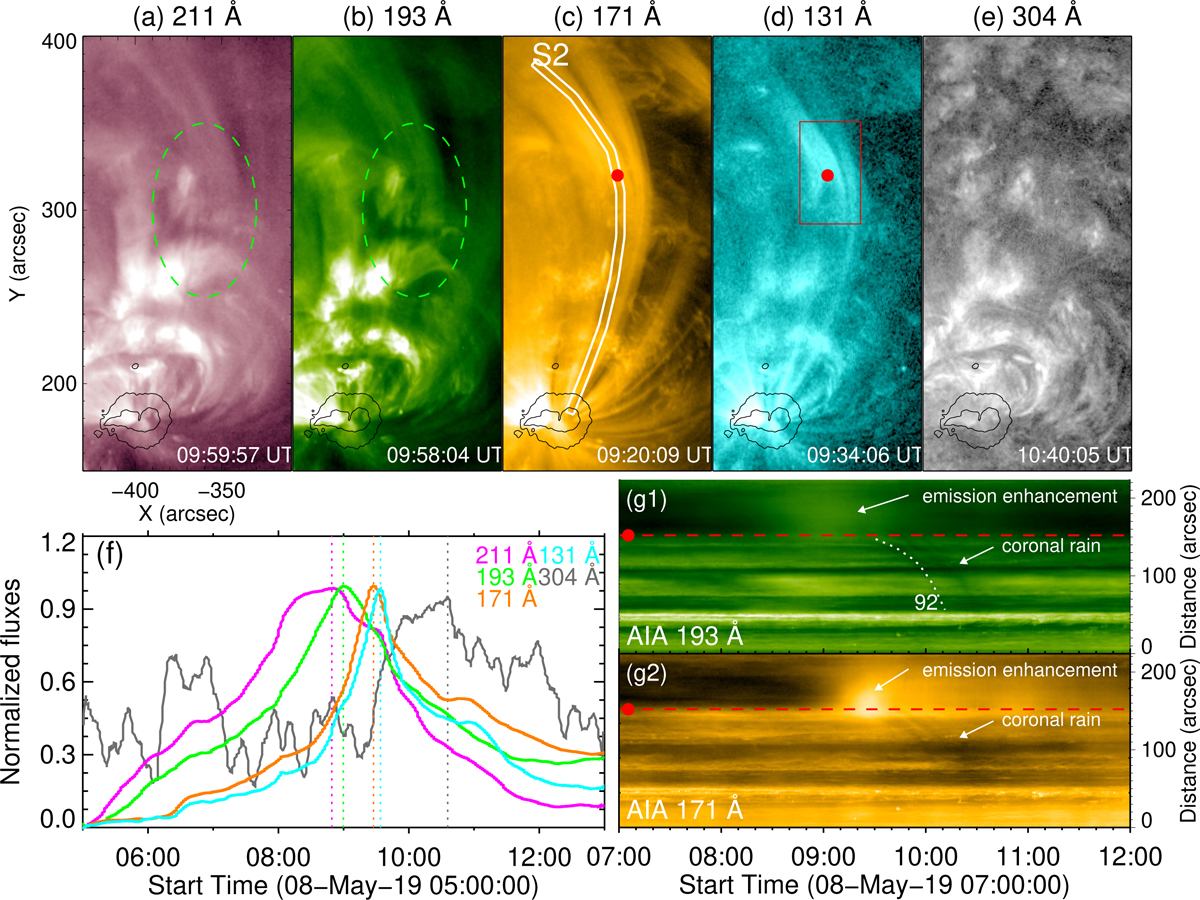
On-disk coronal condensation observed by AIA. (a) 211 Å, (b) 193 Å, (c) 171 Å, (d) 131 Å, and (e) 304 Å images. The green dashed ellipses in panels a and b mark the location of the condensation; the red dots in panels c and d denote the location of a magetic dip region. (f) Normalized light curves of the AIA 211 Å (purple), 193 Å (green), 171 Å (brown), 131 Å (cyan), and 304 Å (gray) channels in the red box shown in panel d. (g) Space-time diagrams of AIA 193 Å and 171 Å intensities for the trajectory “S2” shown in panel c. The white dotted line in panel g1 represents a parabolic fit to the track of one coronal rain flow, and the red dashed lines indicate the dip region. An animation of this figure is available online.
Current usage metrics show cumulative count of Article Views (full-text article views including HTML views, PDF and ePub downloads, according to the available data) and Abstracts Views on Vision4Press platform.
Data correspond to usage on the plateform after 2015. The current usage metrics is available 48-96 hours after online publication and is updated daily on week days.
Initial download of the metrics may take a while.