Fig. 6.
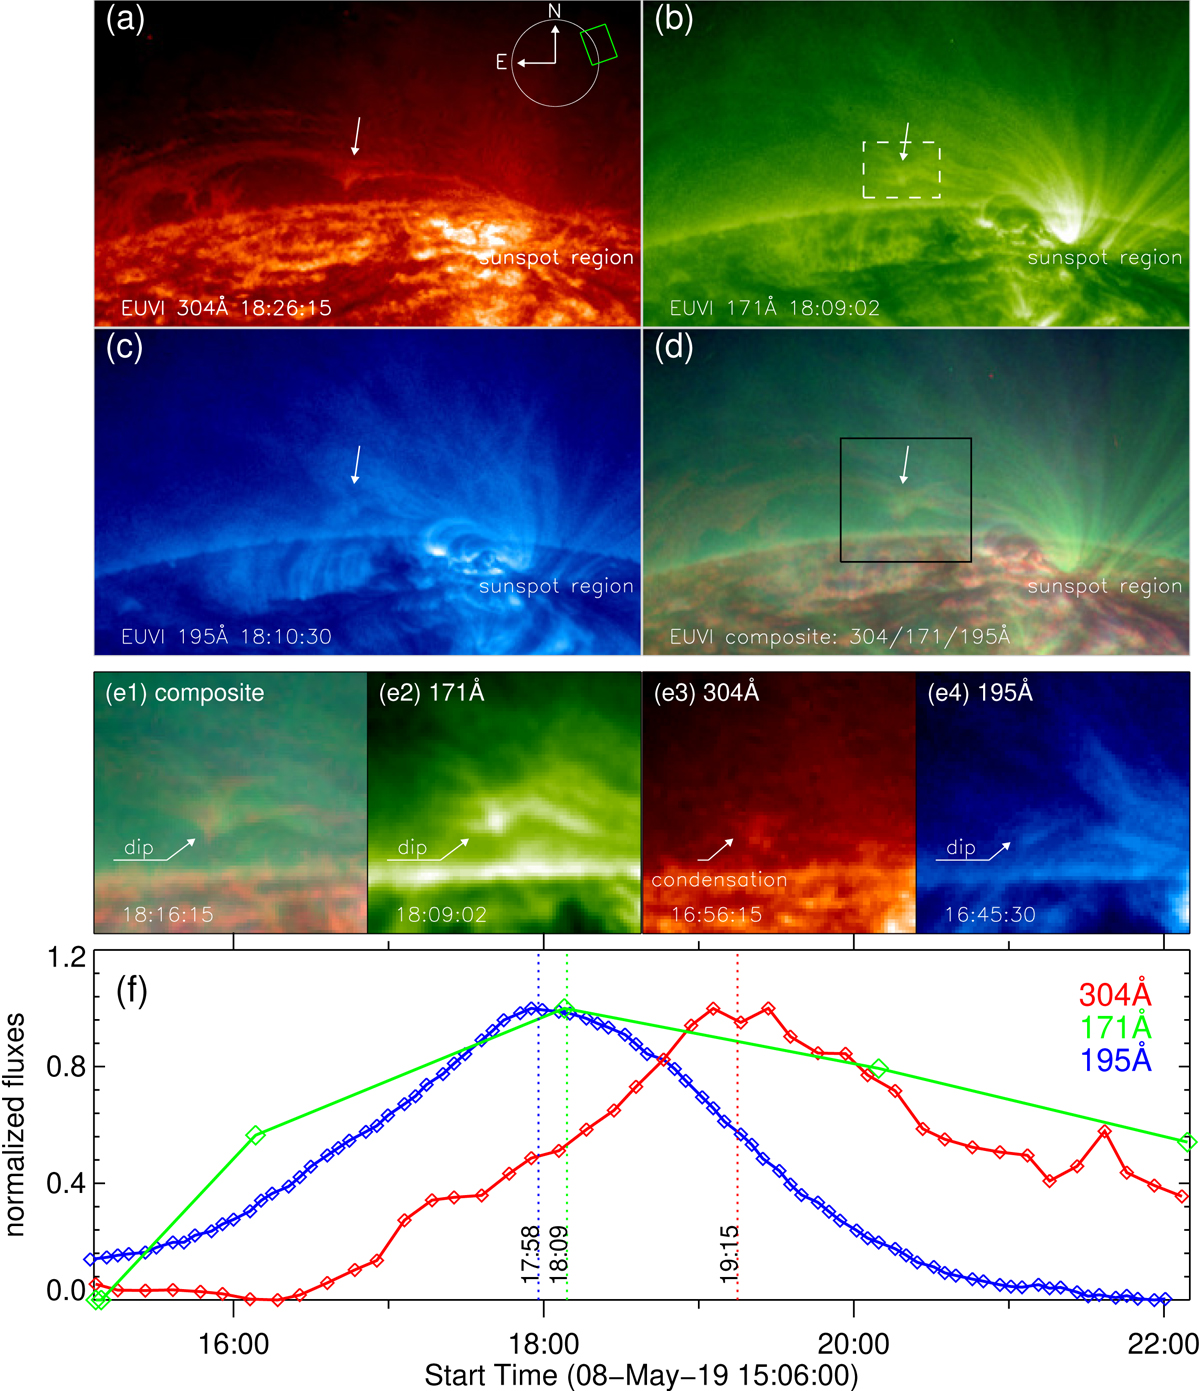
Download original image
Coronal condensation observed by STEREO-A/EUVI during IRIS Raster 5. (a) 304 Å, (b) 171 Å, (c) 195 Å, and (d) their composite images. These images are rotated counterclockwise by an angle of 70 deg. The solar disk and the FOV of these images are shown as the white circle and the green rectangle, respectively. The black rectangle in panel d denotes the FOV of panel e. (e) Four selected close-in snapshots showing the evolution of the (magnetic) dip region at the onset of coronal condensation. White arrows mark the dip and associated condensation. (f) Temporal evolution of the 195 Å (blue), 171 Å (green), and 304 Å (red) intensities integrated over the white box shown in panel b. The vertical blue, green, and red dotted lines mark the peak times of the three light curves, respectively. An animation of this figure is available online.
Current usage metrics show cumulative count of Article Views (full-text article views including HTML views, PDF and ePub downloads, according to the available data) and Abstracts Views on Vision4Press platform.
Data correspond to usage on the plateform after 2015. The current usage metrics is available 48-96 hours after online publication and is updated daily on week days.
Initial download of the metrics may take a while.