Fig. 4.
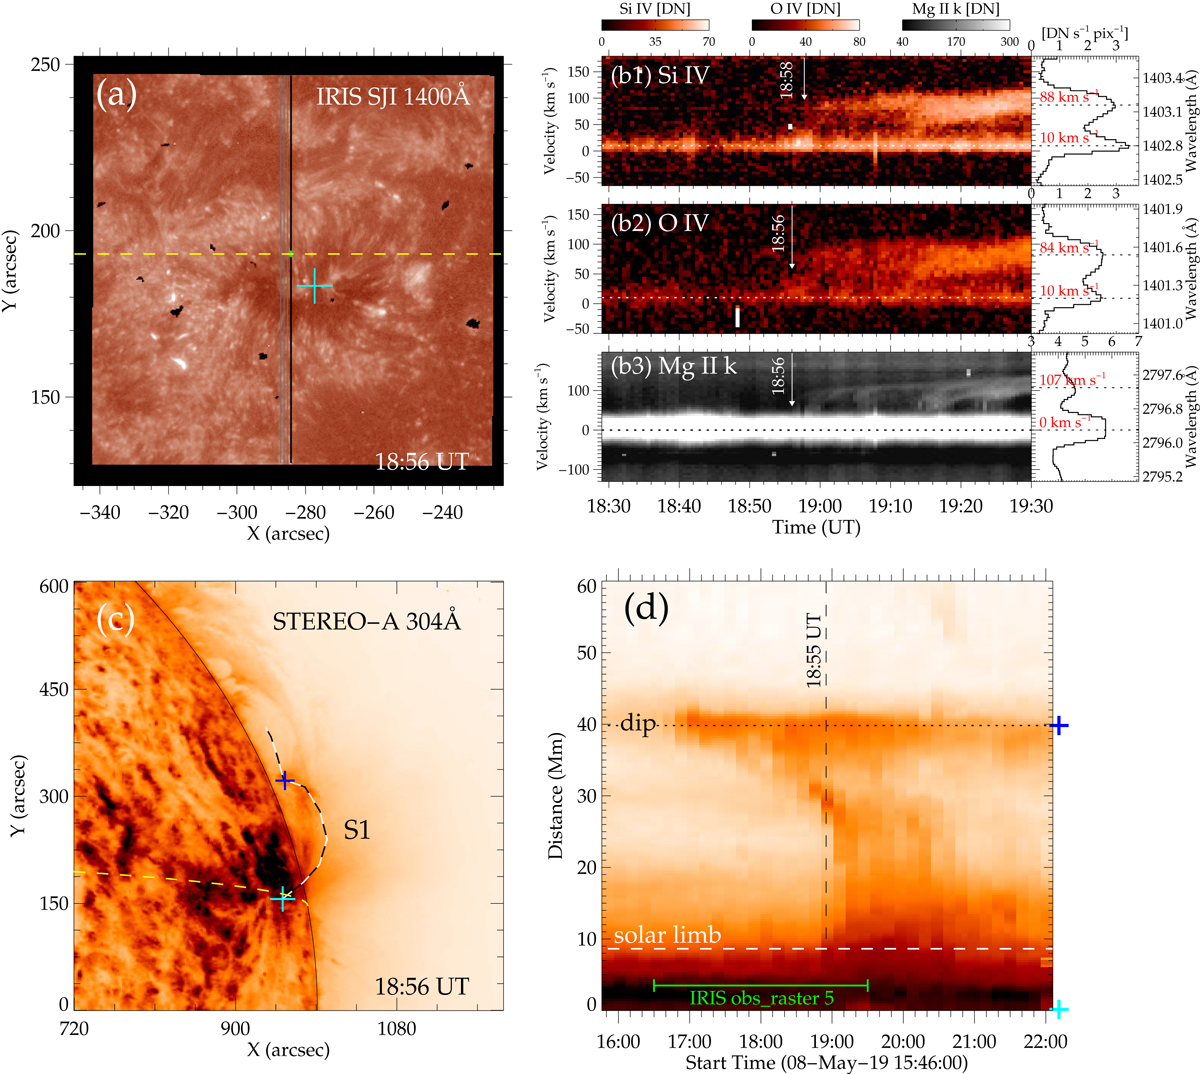
Download original image
Sunspot supersonic downflows (SSDs) detected during IRIS Raster 5 and their associated coronal rain events. (a) An IRIS SJI 1400 Å image. The vertical lines indicate the four slit positions of the four-step raster scans. SSDs were best detected at the last slit position (the black line). (b1)–(b3) Temporal evolution of the Si IV 1403 Å, O IV 1401 Å and Mg II 2796 Å line profiles averaged within the section marked by the green line shown in panel a. The time-averaged spectra are also plotted in the right, and the Doppler shifts of the primary and downflow components are given. The horizontal dotted lines indicate the wavelengths corresponding to the peak intensities of the two components. (c) Corresponding coronal rain event in an EUVI 304 Å image from a different perspective. The (magnetic) dip region is marked by the blue “+” sign. (d) Space-time diagram of EUVI 304 Å intensity for the trajectory “S1” shown in panel c. The period of the IRIS four-step rasters is marked by the green solid line at the bottom. In panels a and c, the cyan plus signs mark the same heliocentric position after considering the solar rotation, and the yellow dashed line is the north 11.9 deg altitude line.
Current usage metrics show cumulative count of Article Views (full-text article views including HTML views, PDF and ePub downloads, according to the available data) and Abstracts Views on Vision4Press platform.
Data correspond to usage on the plateform after 2015. The current usage metrics is available 48-96 hours after online publication and is updated daily on week days.
Initial download of the metrics may take a while.