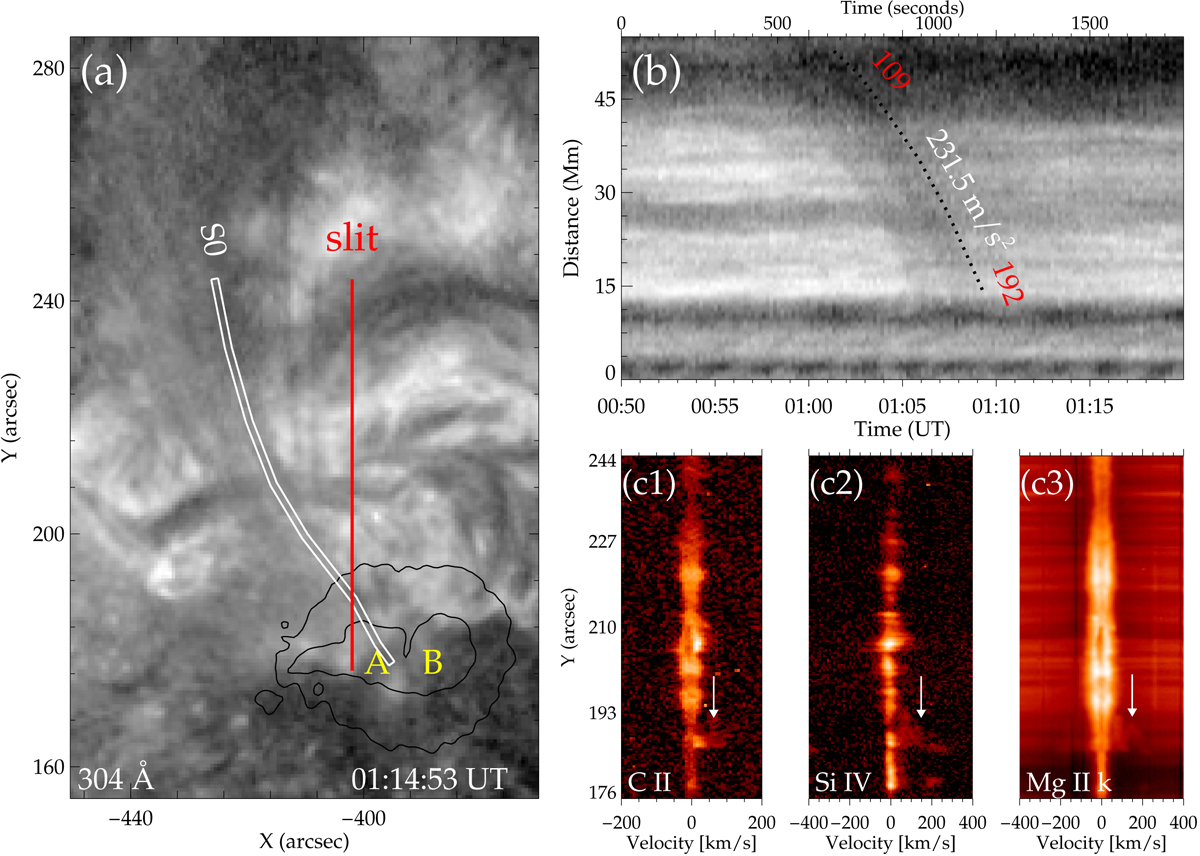
Fig. 3.
Download original image
Temporal relation between coronal rain and sunspot supersonic downflows. (a) An AIA 304 Å image showing the coronal rain falling into region A. The black contours outline the boundaries of the umbra and penumbra. (b) Space-time diagram of AIA 304 Å intensity along the trajectory S0 shown in panel a. The dark dotted line represents a parabolic fit to the track of one coronal rain flow occurring from 00:50 to 01:20 UT. (c) Spectral detector images of the C II 1335 Å Si IV 1403 Å and Mg II k 2796 Å lines along the slit (red vertical line) shown in panel a. The white arrows mark the SSDs caused by the falling coronal rain along trajectory S0. An animation of this figure is available online.
Current usage metrics show cumulative count of Article Views (full-text article views including HTML views, PDF and ePub downloads, according to the available data) and Abstracts Views on Vision4Press platform.
Data correspond to usage on the plateform after 2015. The current usage metrics is available 48-96 hours after online publication and is updated daily on week days.
Initial download of the metrics may take a while.