Fig. 2.
Download original image
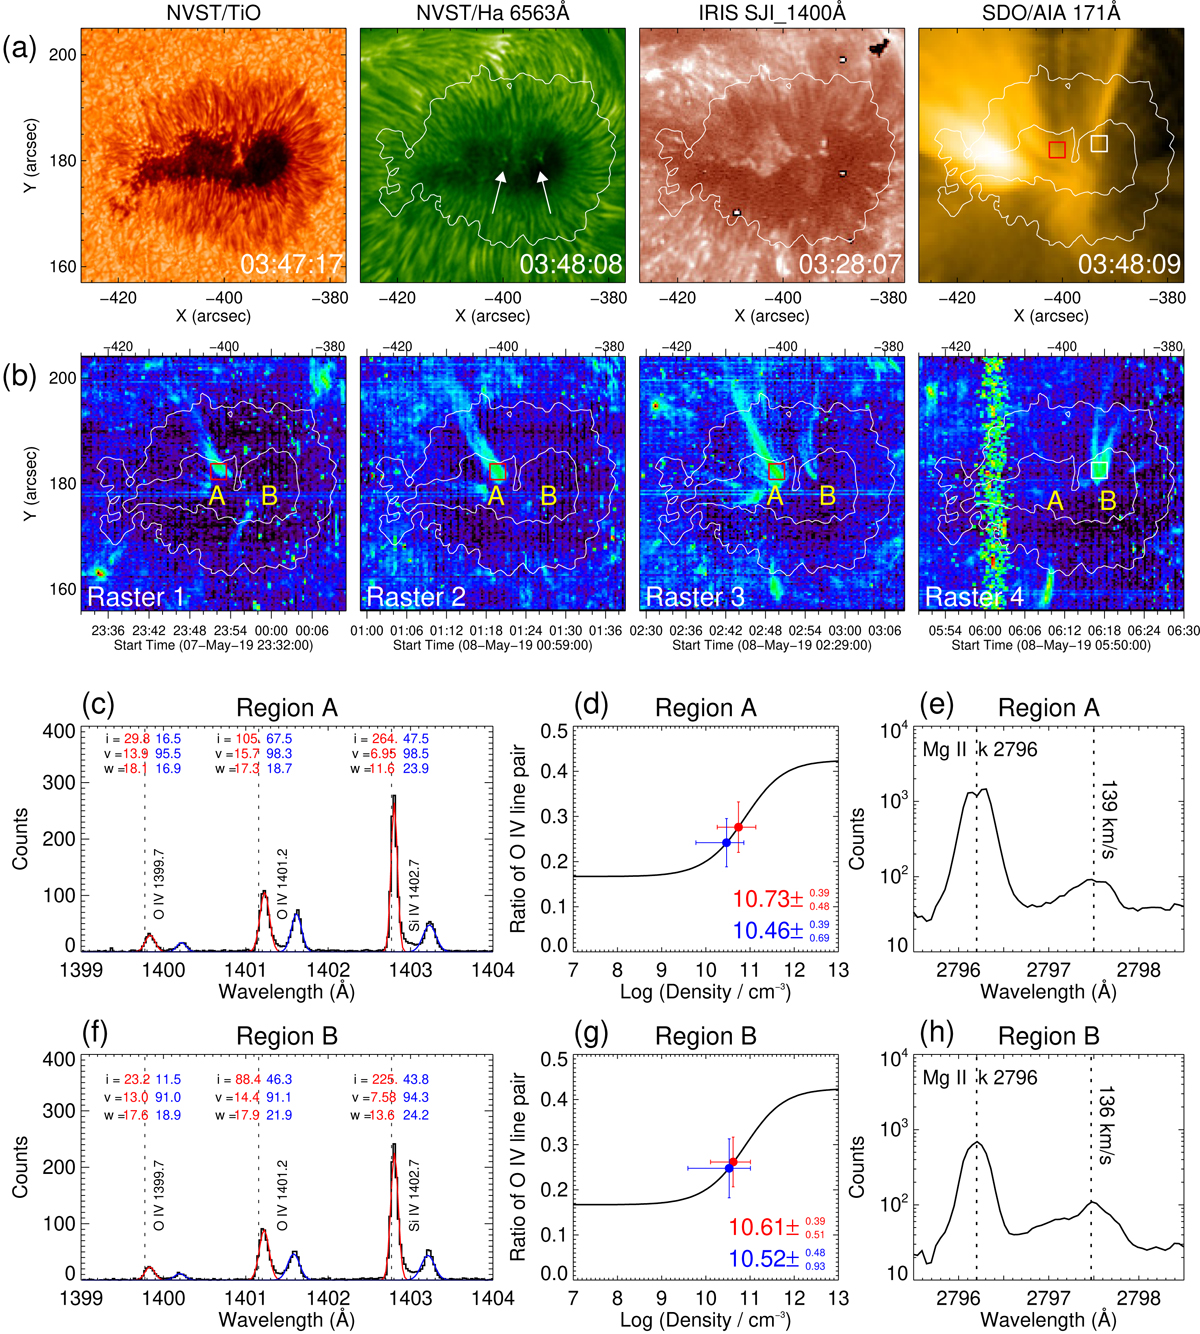
Multiwavelength diagnostics of sunspot supersonic downflows. (a) NVST TiO and 6563 Å, IRIS SJI 1400 Å, and AIA 171 Å images of the target sunspot. The white contours outline the outer boundaries of the sunspot umbra and penumbra. (b) Spatial extent of SSDs as shown in maps of the downflow intensity integrated in the velocity range of 50 km s−1 to 300 km s−1. (c) Average spectrum in the small red box (3″ × 3″) shown in panel b (Raster 3). A six-component Gaussian fit to the spectrum is shown as the red (primary component) and blue lines (secondary component). The fitting parameters, including the peak intensity (i), Doppler shift (v), and line width (w), are also given for each line. (d) The black curve shows the theoretical relationship between the electron density and the ratio of the O IV doublet. The blue and red solid circles (error bars) represent the density diagnostic results (associated uncertainties) of the secondary and primary components in region A, respectively. (e) Average Mg II k 2796 Å line profile in region A (Raster 3). The two vertical dotted lines mark the two components. (f)–(h) Same as panels c–e, but for the SSDs in region B. The spectrum in panel f was averaged over the small white box (3″ × 3″) shown in panel b (Raster 4).
Current usage metrics show cumulative count of Article Views (full-text article views including HTML views, PDF and ePub downloads, according to the available data) and Abstracts Views on Vision4Press platform.
Data correspond to usage on the plateform after 2015. The current usage metrics is available 48-96 hours after online publication and is updated daily on week days.
Initial download of the metrics may take a while.