Fig. 13.
Download original image
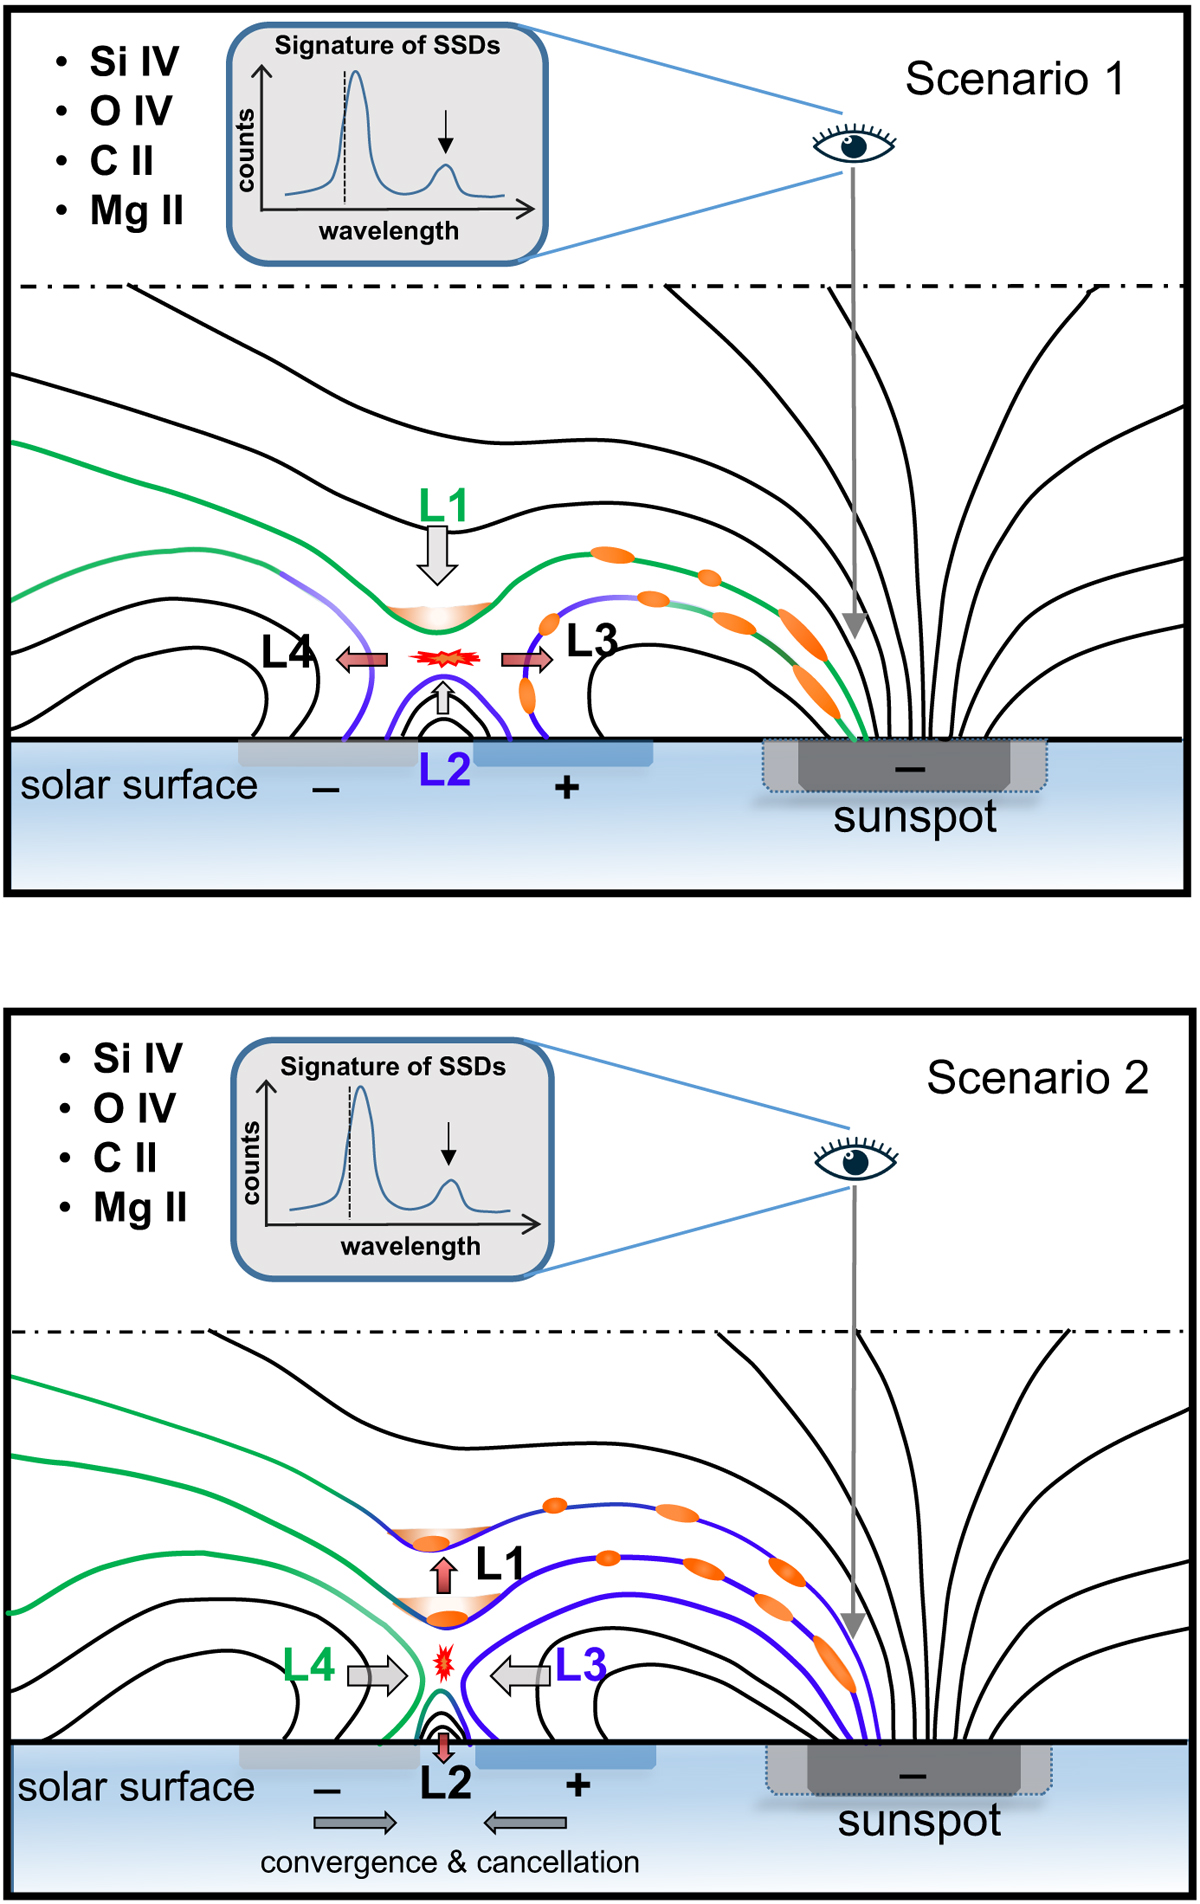
Two possible scenarios for the magnetic dip formation, subsequent coronal condensation, and supersonic downflows. The “+” and “−” signs denote the positive- and negative- polarity magnetic fields on the solar surface, and the solid lines represent magnetic field lines. Near the reconnection site (red explosive feature), four groups of field lines, “L1”, “L2”, “L3” and “L4”, are highlighted by green and blue solid lines. The gray arrows indicate the converging motion of existing loops to the reconnection site, while the red arrows mark the diverging motion of newly formed loops from the reconnection site. The brown shadowed regions represent coronal rain clumps. It should be noted that “L4” in the top panel and “L2” in the bottom panel may also exhibit coronal rain.
Current usage metrics show cumulative count of Article Views (full-text article views including HTML views, PDF and ePub downloads, according to the available data) and Abstracts Views on Vision4Press platform.
Data correspond to usage on the plateform after 2015. The current usage metrics is available 48-96 hours after online publication and is updated daily on week days.
Initial download of the metrics may take a while.