Fig. 10.
Download original image
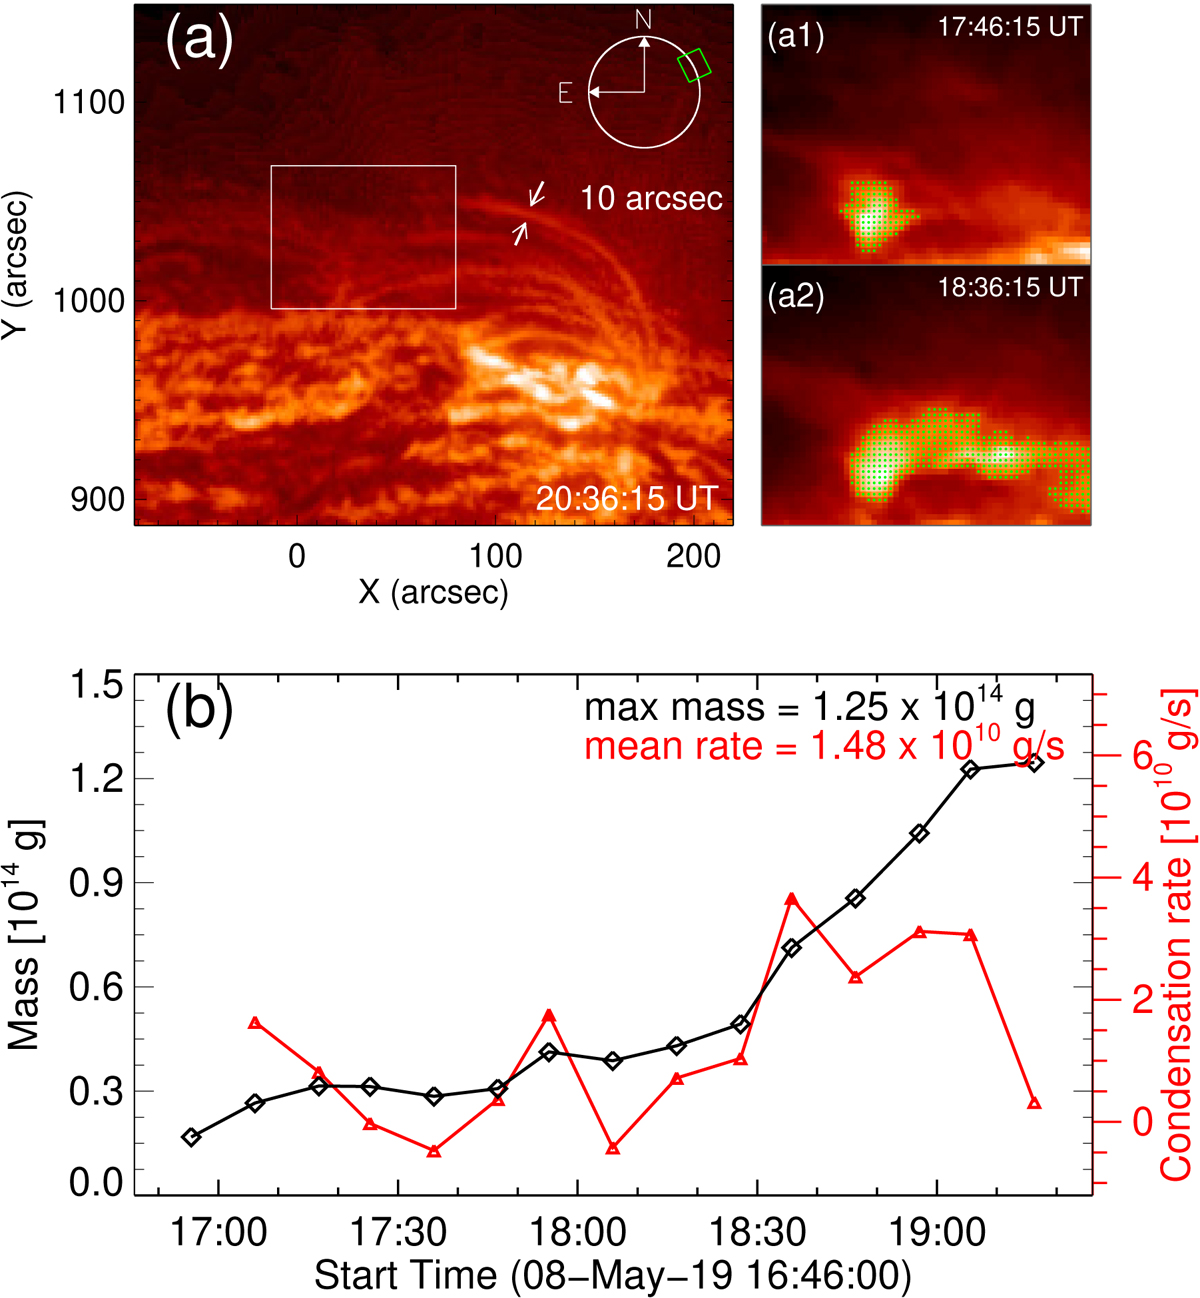
Source of sunspot supersonic downflows. (a) An EUVI 304 Å image showing the condensation-related dip region. The solar disk and the FOV of these images are shown as the white circle and the green rectangle, respectively. The two arrows indicate the thickness for a condensation clump. (a1) and (a2) Examples of condensation identification in the white box of panel a at two different times. The green dots denote the pixels where condensation takes place. (b) Time variation of the condensation mass (black diamonds) and condensation rate (red triangles) during the period of 16:46−19:26 UT (IRIS Raster 5).
Current usage metrics show cumulative count of Article Views (full-text article views including HTML views, PDF and ePub downloads, according to the available data) and Abstracts Views on Vision4Press platform.
Data correspond to usage on the plateform after 2015. The current usage metrics is available 48-96 hours after online publication and is updated daily on week days.
Initial download of the metrics may take a while.