Fig. 1.
Download original image
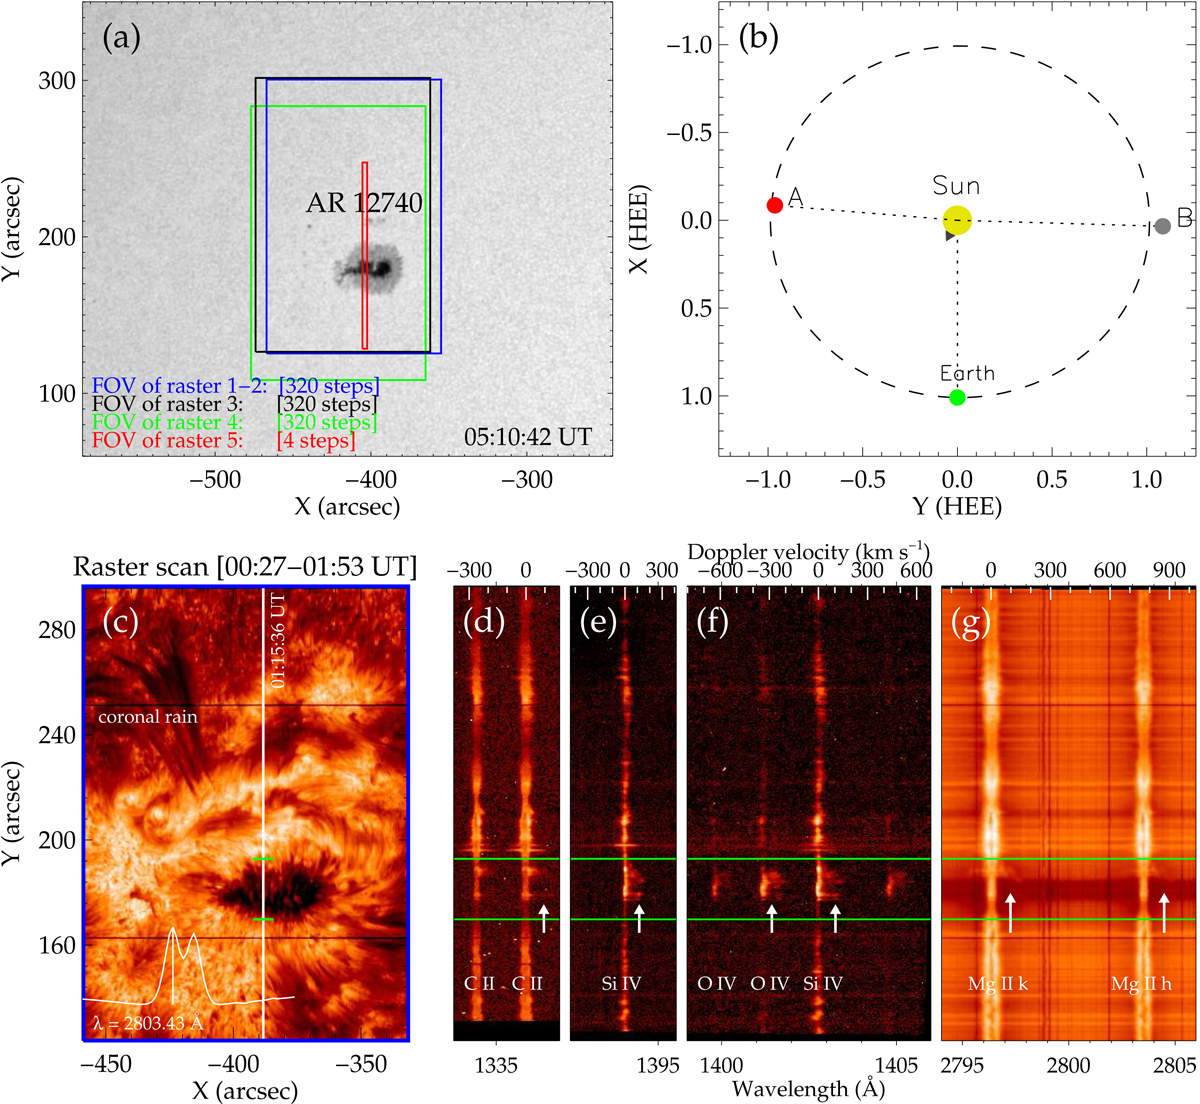
Overview of the region of interest. (a) HMI continuum image of NOAA AR 12740. The rectangles outlined by the blue, black, green, and red lines indicate the fields of view (FOVs) of spectral observations for IRIS rasters 1−2, 3, 4, and 5, respectively. (b) Positions of the STEREO-A spacecraft in the ecliptic plane at 05:30 UT on 2019 May 8. The target region was simultaneously observed by the STEREO-A and SDO from two perspectives. (c) An image of an IRIS raster scan at Mg II k 2803.43 Å. The vertical white line indicates the IRIS slit location. (d)–(g) IRIS spectra along the slit shown in panel c. The green horizontal lines mark the location of the sunspot. The two white arrows in (g) indicate the downflow components of the Mg II lines. An animation of this figure is available online.
Current usage metrics show cumulative count of Article Views (full-text article views including HTML views, PDF and ePub downloads, according to the available data) and Abstracts Views on Vision4Press platform.
Data correspond to usage on the plateform after 2015. The current usage metrics is available 48-96 hours after online publication and is updated daily on week days.
Initial download of the metrics may take a while.