Open Access
Fig. 6.
Download original image
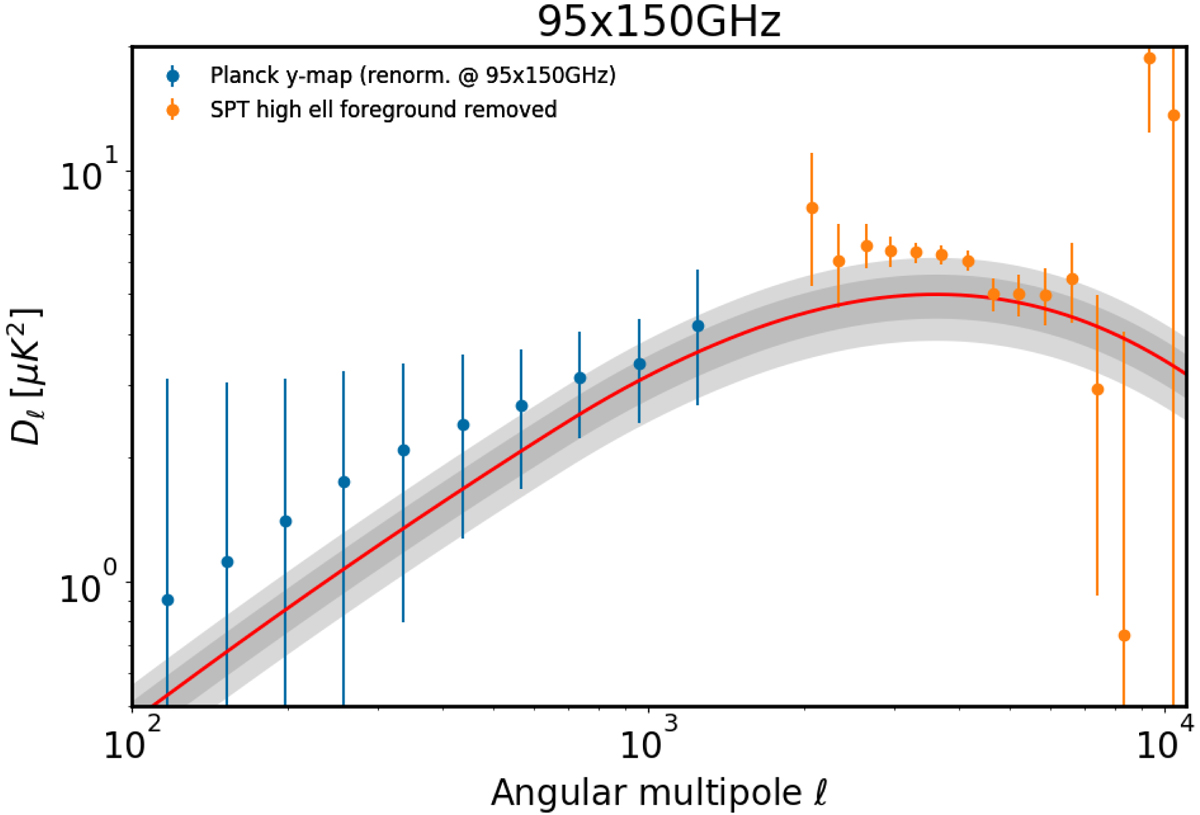
Best-fit SZ spectra of SPT (in orange) and Planck21-tSZ (in blue) data, foregrounds removed, at 95 × 150 GHz, when both of them are fitted simultaneously. The grey bands show the 1 and 2σ uncertainty on the best model. Similar plot for all cross spectra are shown in Appendix C.
Current usage metrics show cumulative count of Article Views (full-text article views including HTML views, PDF and ePub downloads, according to the available data) and Abstracts Views on Vision4Press platform.
Data correspond to usage on the plateform after 2015. The current usage metrics is available 48-96 hours after online publication and is updated daily on week days.
Initial download of the metrics may take a while.