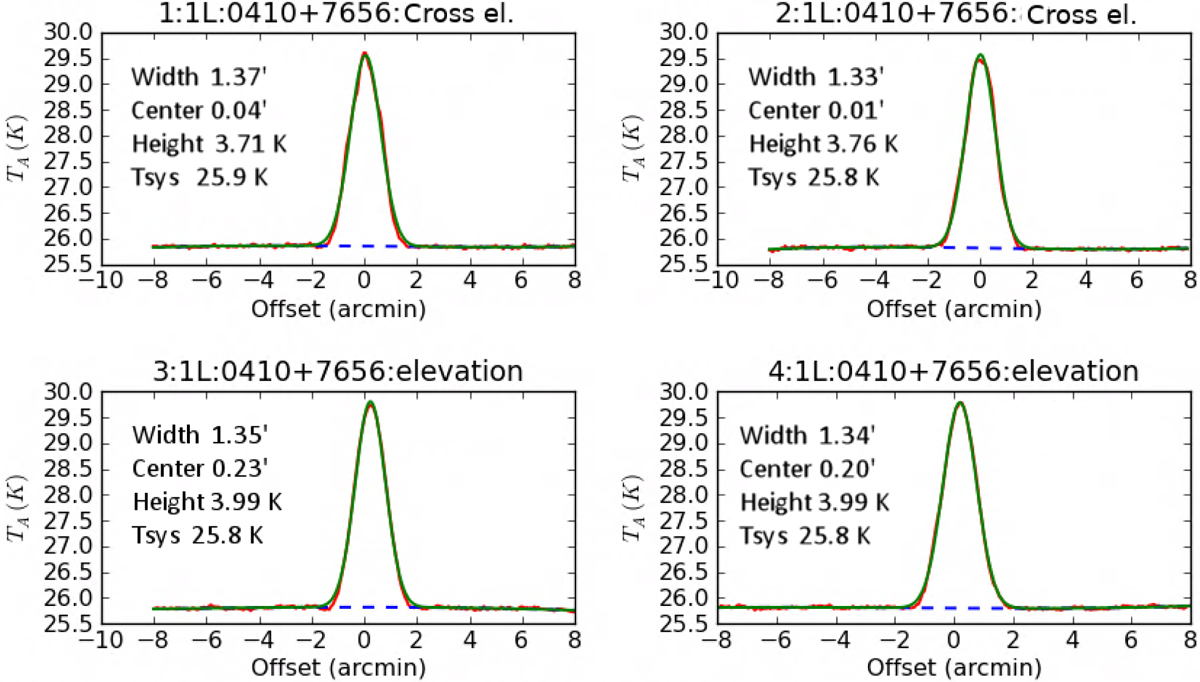
Fig. 4.
Download original image
Plot of the four component scans that make up a single pointing calibration measurement from a 2018 X-band pointing observation session; this diagram was generated using the GBT Fits Monitor (GFM) software. The dashed blue line represents the fitted baseline, the green line represents the modeled Gaussian, and the red line is real data.
Current usage metrics show cumulative count of Article Views (full-text article views including HTML views, PDF and ePub downloads, according to the available data) and Abstracts Views on Vision4Press platform.
Data correspond to usage on the plateform after 2015. The current usage metrics is available 48-96 hours after online publication and is updated daily on week days.
Initial download of the metrics may take a while.