Fig. 7.
Download original image
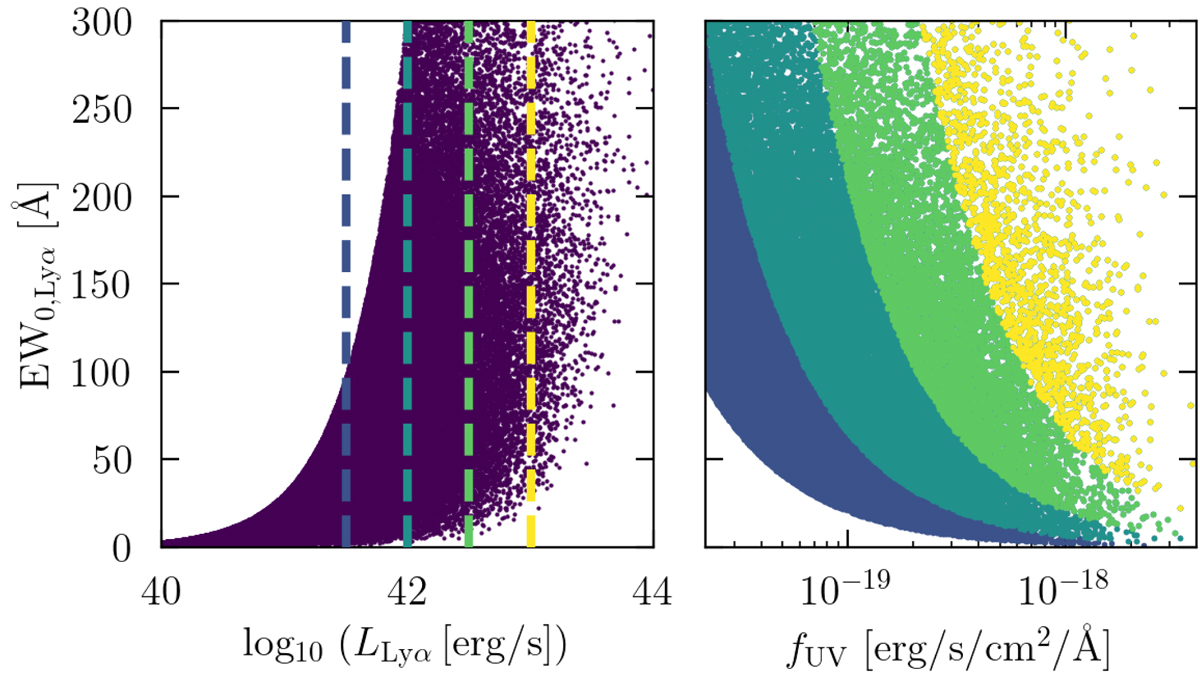
Statistical experiment to understand the cuts of Lyman α luminosity on EW0. Left panel: Lyman α EW0 over Lyman α line luminosity for 10 000 simulated objects (purple dots). The dashed lines indicate different luminosity cuts in the Lyman α line at log10(LLyα[erg s−1]) = [41.5,42,42.5,43]. Right panel: Lyman α EW0 over the UV continuum luminosity. The different colours correspond to the different line luminosity cuts in the left panel.
Current usage metrics show cumulative count of Article Views (full-text article views including HTML views, PDF and ePub downloads, according to the available data) and Abstracts Views on Vision4Press platform.
Data correspond to usage on the plateform after 2015. The current usage metrics is available 48-96 hours after online publication and is updated daily on week days.
Initial download of the metrics may take a while.