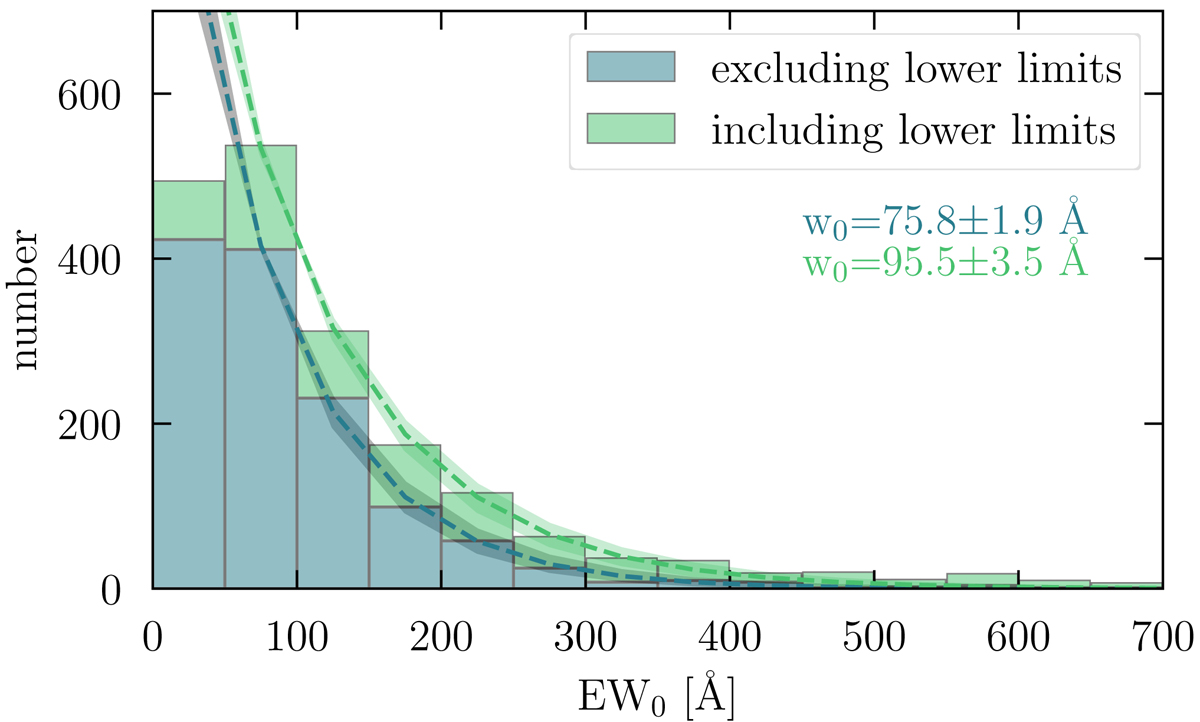
Fig. 6.
Download original image
Histograms of the Lyman α EW0 of the full sample, including both MUSE-Wide and MUSE-Deep objects. The blue histogram shows the objects with a secure measurement (excluding lower limits), the green bars on top show the objects with a limiting EW0. The exponential fits N = N0 exp(−EW0/w0) are shown as the dashed lines, blue for the objects with secure measurements and light green for the full sample including lower limits. The bin width in EW0 is 50 Å. For the measurement of the characteristic EW0w0 (given below the legend and in Table 4) the smallest EW0 bin was excluded as it is likely incomplete (as Lyman α lines with small or zero line fluxes are hard to detect and preferentially result in small EW0). The shaded areas around the dashed lines indicate the exponential fits for the EW0 distributions using UV continuum slopes of β = −1.57 and −2.29, the first and last quartiles of the distribution of measured β values.
Current usage metrics show cumulative count of Article Views (full-text article views including HTML views, PDF and ePub downloads, according to the available data) and Abstracts Views on Vision4Press platform.
Data correspond to usage on the plateform after 2015. The current usage metrics is available 48-96 hours after online publication and is updated daily on week days.
Initial download of the metrics may take a while.