Fig. 5.
Download original image
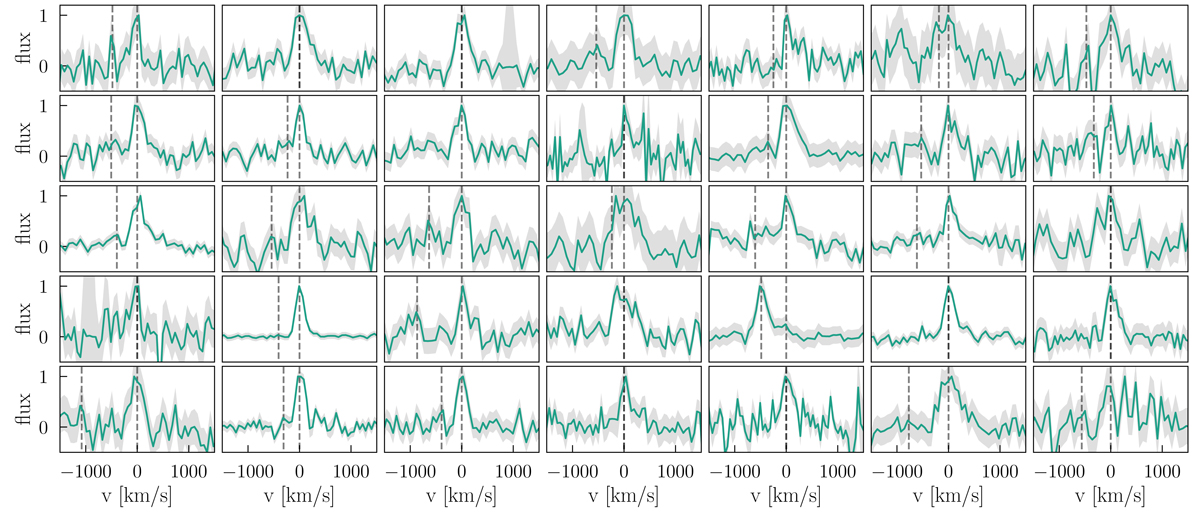
Overview of the Lyman α emission lines of the 35 LAEs with the highest measured EW0, sorted by EW0 in descending order (left to right, top to bottom). We note that the y-axis shows the flux normalised to the maximum of each peak for better comparison. The vertical dashed lines indicate the positions of the Lyman α lines and the blue bump if there is one. The grey shaded area shows the standard deviation from the MUSE spectra. The shown objects are taken both from the MUSE-Wide and -Deep surveys and have been continuum subtracted.
Current usage metrics show cumulative count of Article Views (full-text article views including HTML views, PDF and ePub downloads, according to the available data) and Abstracts Views on Vision4Press platform.
Data correspond to usage on the plateform after 2015. The current usage metrics is available 48-96 hours after online publication and is updated daily on week days.
Initial download of the metrics may take a while.