Fig. 20.
Download original image
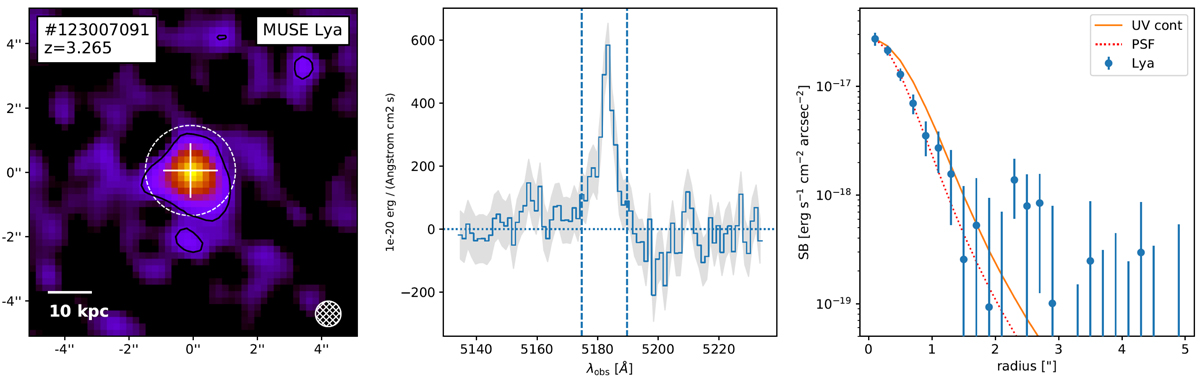
Measurements of the Lyman α halo of object 123007091 as in Leclercq et al. (2017). The left panel shows the MUSE Lyman α narrow-band image, smoothed slightly with the PSF FWHM Gaussian kernel, indicated by the white hatched circle in the lower right corner. The black lines show the 2σ surface brightness limit, the white dashed circle shows the extraction aperture for the spectrum of the Lyman α emission line. The latter is shown in the middle panel, with vertical lines indicating the width of the narrow-band image. The right panel shows the extent of the Lyman α halo in blue and the continuum component in orange, as well as the PSF (red dotted line).
Current usage metrics show cumulative count of Article Views (full-text article views including HTML views, PDF and ePub downloads, according to the available data) and Abstracts Views on Vision4Press platform.
Data correspond to usage on the plateform after 2015. The current usage metrics is available 48-96 hours after online publication and is updated daily on week days.
Initial download of the metrics may take a while.