Fig. 18.
Download original image
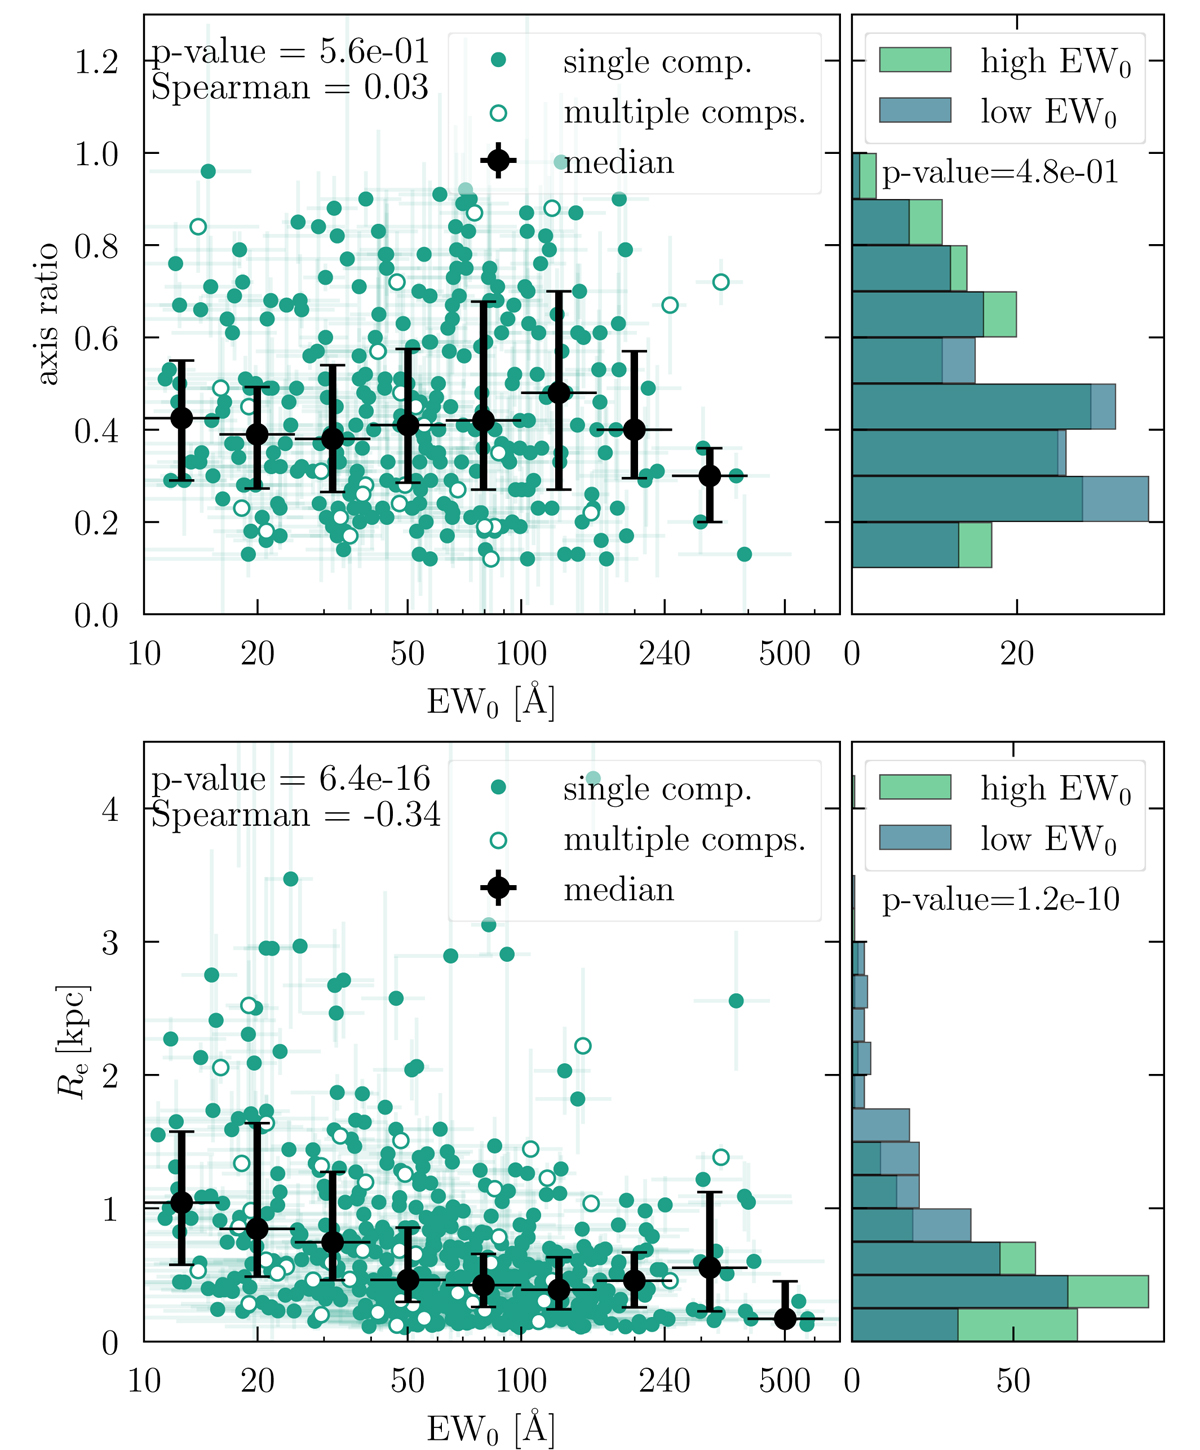
Two different measures of properties of the UV continuum counterparts of the LAEs (measured in the HST photometry) compared to the rest-frame EW of the Lyman α line. Top panel: axis ratio over EW0, bottom panel: effective radius (in physical kpc) over EW0. As in Fig. 13, the black dots show the median values in bins of Δ(log10(EW0)) = 0.2, indicated by the widths of their error bars in x-direction with the first and last quartiles of the values in each bin indicated by the y-axis error bar. However, for these two plots, objects with a UV continuum counterpart consisting of only one component are shown as filled dots, objects with multiple components are shown in empty dots. For the latter, the brightest component was used to measure the size and axis ratio. The histograms show again the higher EW0 (green) and lower EW0 (blue) half of the sample, the axis ratio in bins of 0.1, and the effective radius in bins of 0.2.
Current usage metrics show cumulative count of Article Views (full-text article views including HTML views, PDF and ePub downloads, according to the available data) and Abstracts Views on Vision4Press platform.
Data correspond to usage on the plateform after 2015. The current usage metrics is available 48-96 hours after online publication and is updated daily on week days.
Initial download of the metrics may take a while.