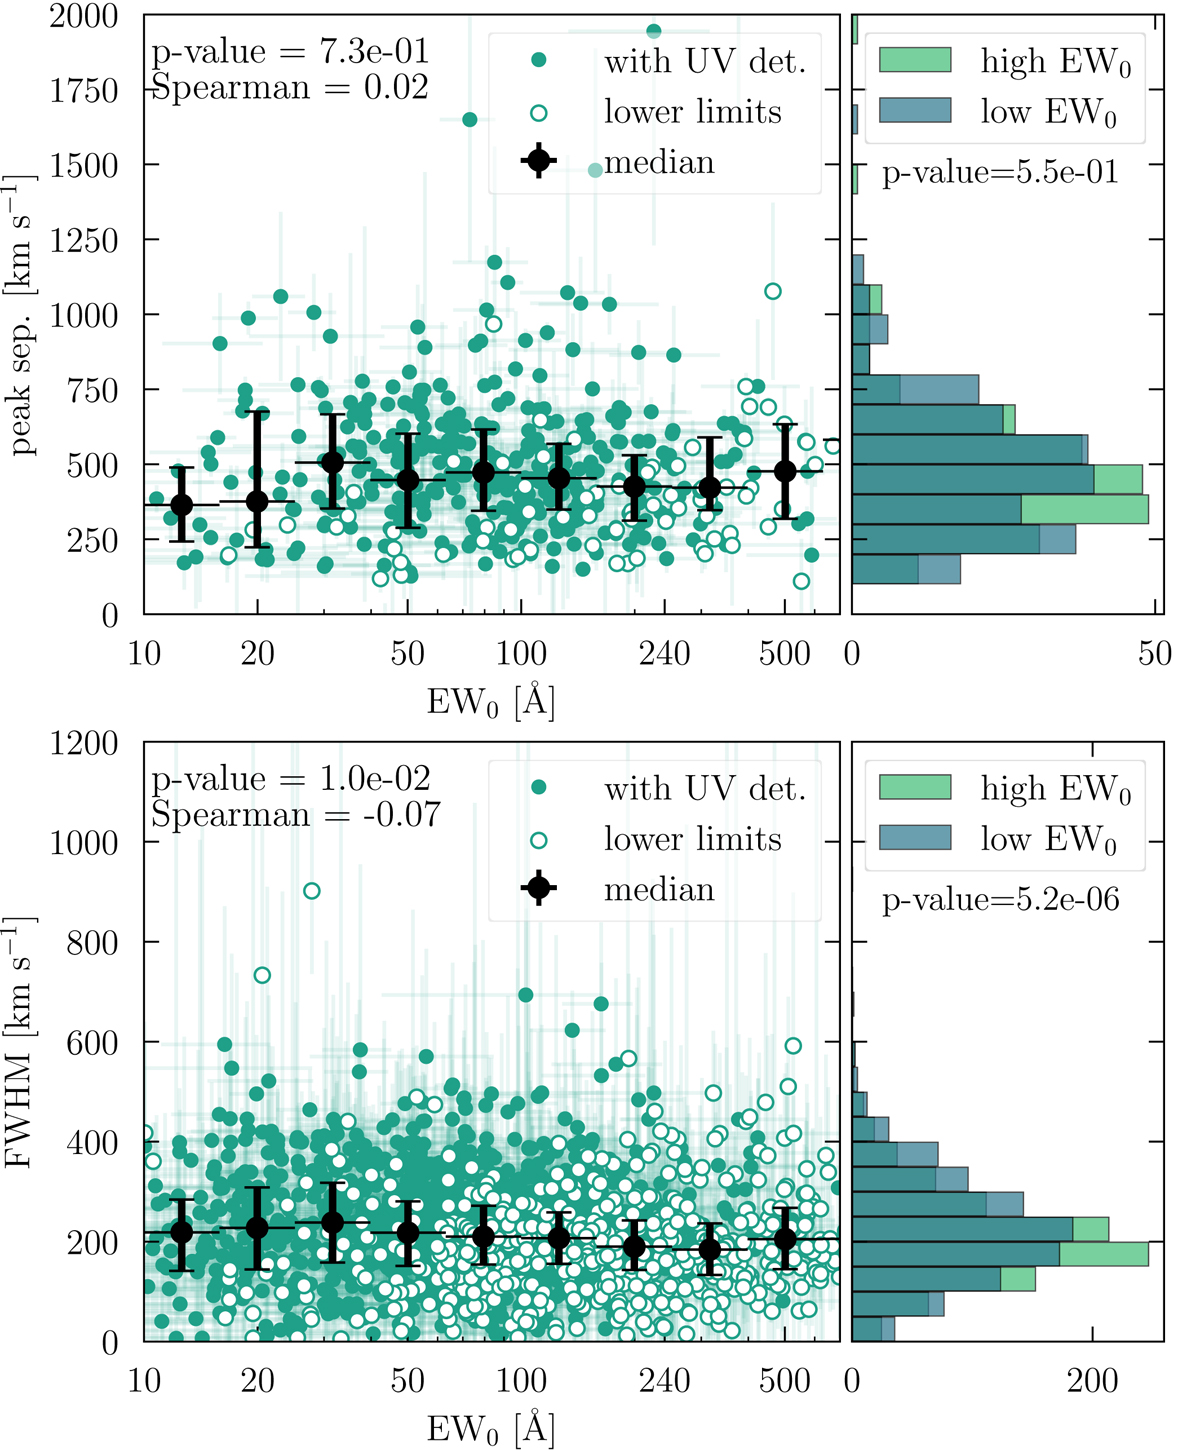
Fig. 15.
Download original image
Two properties of the Lyman α line plotted against EW0 in Å (in logarithmic scaling). Top panel: peak separation (for objects with a double peaked Lyman α line) in km s−1, bottom panel: FWHM of the main line (for all objects). The symbols are the same as in Fig. 13, the histograms to the right of the plots show again the distribution separated into the half with higher EW0 (in green) and the half with lower EW0 (in blue). The bin width for the histogram for the peak separation is 50 km s−1, the bin width for the histogram for the FWHM is 100 km s−1, the p-value is given based on a KS-test.
Current usage metrics show cumulative count of Article Views (full-text article views including HTML views, PDF and ePub downloads, according to the available data) and Abstracts Views on Vision4Press platform.
Data correspond to usage on the plateform after 2015. The current usage metrics is available 48-96 hours after online publication and is updated daily on week days.
Initial download of the metrics may take a while.