Fig. 14.
Download original image
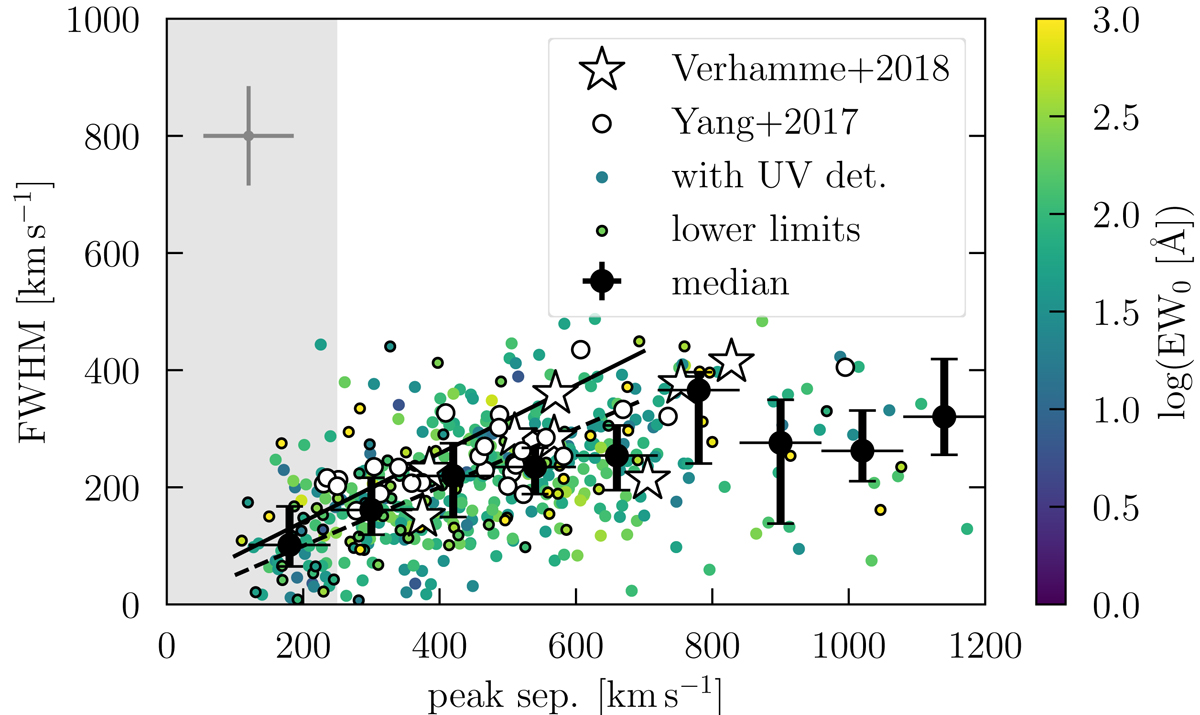
FWHM of the main (red) peak of the Lyman α line plotted against the peak separation, both in km s−1, colour-coded by the logarithmic EW0. Coloured dots with black circles show objects without UV continuum counterparts. The grey bar in the top left corner shows the median errors. The black dots with error bars are binned median values. The x-axis error bars show the bin widths of 120 km s−1, the y-axis error bars show the first and last quartiles. The grey area is the peak separation range for which Izotov et al. (2018b) show a significant (> 10%) Lyman continuum escape fraction for their sample of low-redshift LyC leakers. The white stars indicate a sample of high-redshift LAEs compiled by Verhamme et al. (2018) (using those objects where the peak separation is given in their Table 1) with measured systemic redshifts. The black line shows their correlation, the dashed line the theoretical line where the peak separation is twice the FWHM. The white dots show a compilation of Green Peas from Yang et al. (2017) (values taken from their Table 3, peak separations are the sum of the individual peak shifts).
Current usage metrics show cumulative count of Article Views (full-text article views including HTML views, PDF and ePub downloads, according to the available data) and Abstracts Views on Vision4Press platform.
Data correspond to usage on the plateform after 2015. The current usage metrics is available 48-96 hours after online publication and is updated daily on week days.
Initial download of the metrics may take a while.