Fig. 11.
Download original image
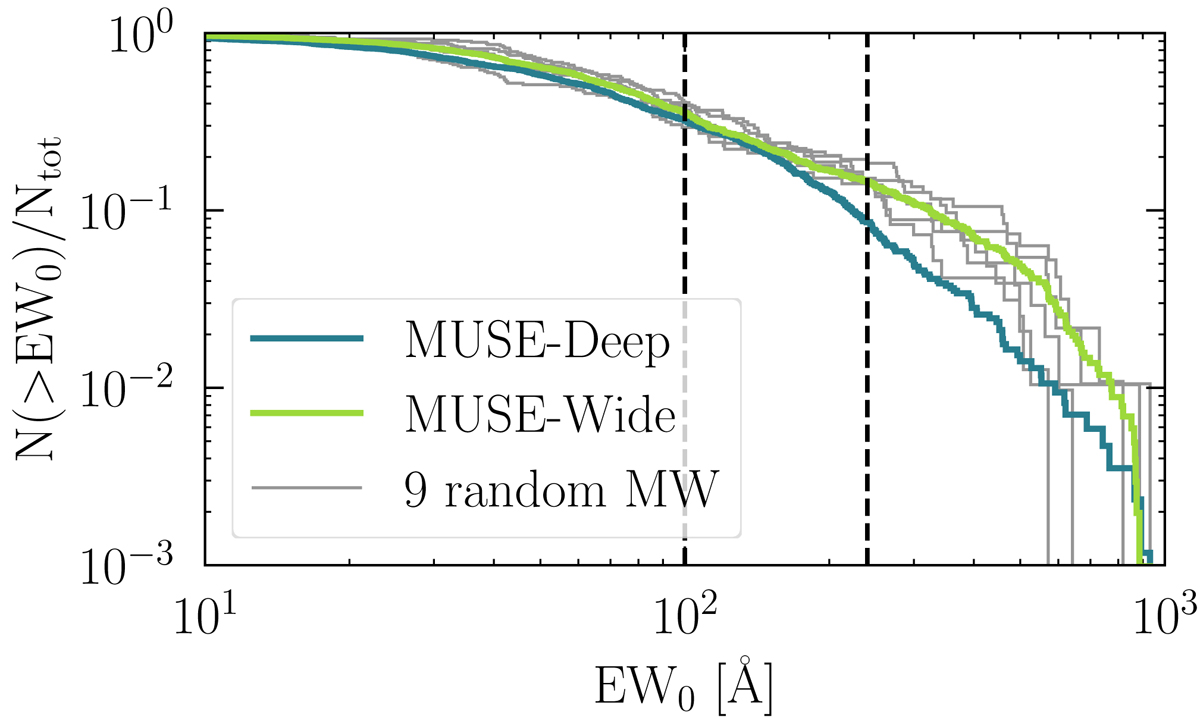
Cumulative distribution of Lyman α EW0 divided into MUSE-Wide (thick green line) and MUSE-Deep (thick blue line). The lines show the samples including objects with no detected UV continuum in the HST images, each step indicates an individual object. For the objects with UV continuum counterparts, the 1σ error was subtracted from the measured EW0 in order to show the same lower limits as for objects without a continuum counterpart. The grey lines show the cumulative distributions of EW0 for the MUSE-Wide data in an area of a similar size as MUSE-Deep, by picking nine MUSE-Wide fields at random. The black dashed lines indicate EW0 = 100 Å and EW0 = 240 Å.
Current usage metrics show cumulative count of Article Views (full-text article views including HTML views, PDF and ePub downloads, according to the available data) and Abstracts Views on Vision4Press platform.
Data correspond to usage on the plateform after 2015. The current usage metrics is available 48-96 hours after online publication and is updated daily on week days.
Initial download of the metrics may take a while.