Fig. 10.
Download original image
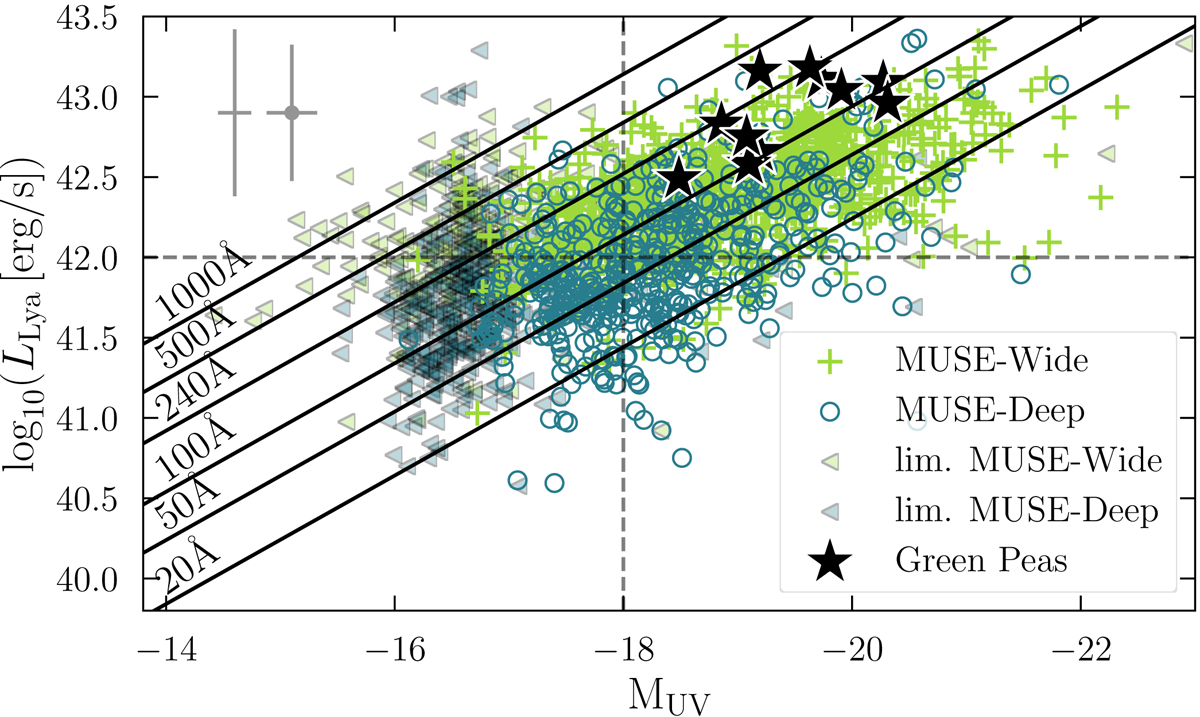
Logarithmic Lyman α luminosity log10(LLyα[erg s−1]) plotted against the UV continuum magnitude MUV, divided into MUSE-Wide (light green crosses and triangles) and MUSE-Deep (dark green open dots and triangles). The triangles show upper 1σ limits of MUV for HST undetected objects. The diagonal black lines are lines of equal equivalent widths (at the median redshift of z ≈ 4 and using a β value of −1.97) to guide the eye. The grey dashed lines indicate MUV = −18 and log10(LLyα[erg s−1]) = 42. The grey crosses in the top left corner show the median sizes of the errors (for objects with HST counterparts). The black stars show Green Pea galaxies from Izotov et al. (2016a,b, 2018a,b) that were all found to be leaking Lyman continuum.
Current usage metrics show cumulative count of Article Views (full-text article views including HTML views, PDF and ePub downloads, according to the available data) and Abstracts Views on Vision4Press platform.
Data correspond to usage on the plateform after 2015. The current usage metrics is available 48-96 hours after online publication and is updated daily on week days.
Initial download of the metrics may take a while.