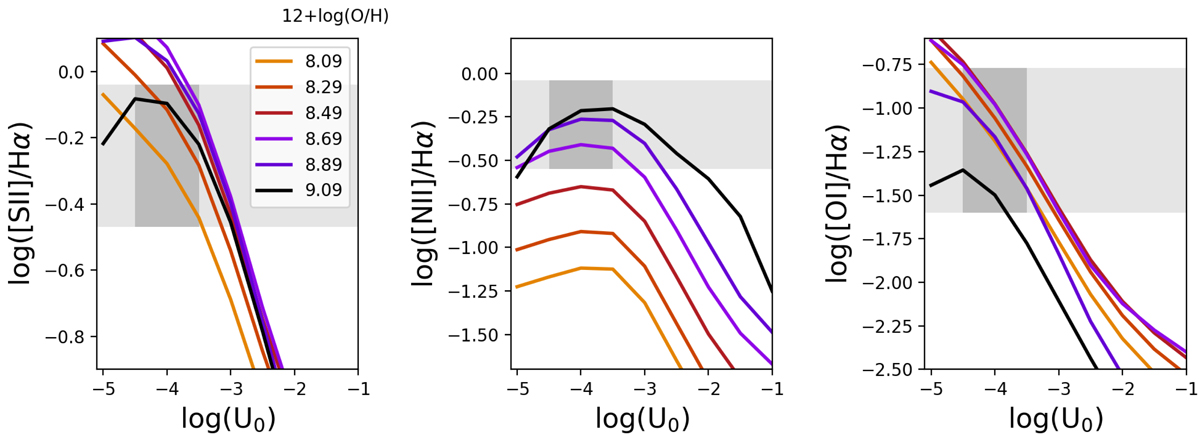
Fig. 9.
Download original image
Model predictions for changes in low-ionisation line ratios with ionisation parameter in the case of leaking radiation. Models are computed with CLOUDY v17.02 and a 2 Myr SSP spectrum generated with FSPS as input. The line ratios, from left to right log([S II]/Hα), log([N II]/Hα), and log([O I]/Hα), are plotted as a function of the ionisation parameter at the incident surface of the cloud (log(U0)). Different colours correspond to different gas-phase metallicities, as indicated in the legend. The light grey band corresponds to the 10th and the 90th percentiles of the observed line ratios in the DIG across all the galaxies in our sample. We further highlight in dark grey the area of log(U0) = [−4.5, −3.5], corresponding to the expected range of ionisation parameter values in the DIG. The models span the range of observed line ratios in the DIG for the expected values of log(U0) in the case of log([S II]/Hα) and log([O I]/Hα), while they fall somewhat short of reproducing the highest line ratios for log([N II]/Hα).
Current usage metrics show cumulative count of Article Views (full-text article views including HTML views, PDF and ePub downloads, according to the available data) and Abstracts Views on Vision4Press platform.
Data correspond to usage on the plateform after 2015. The current usage metrics is available 48-96 hours after online publication and is updated daily on week days.
Initial download of the metrics may take a while.