Fig. 8.
Download original image
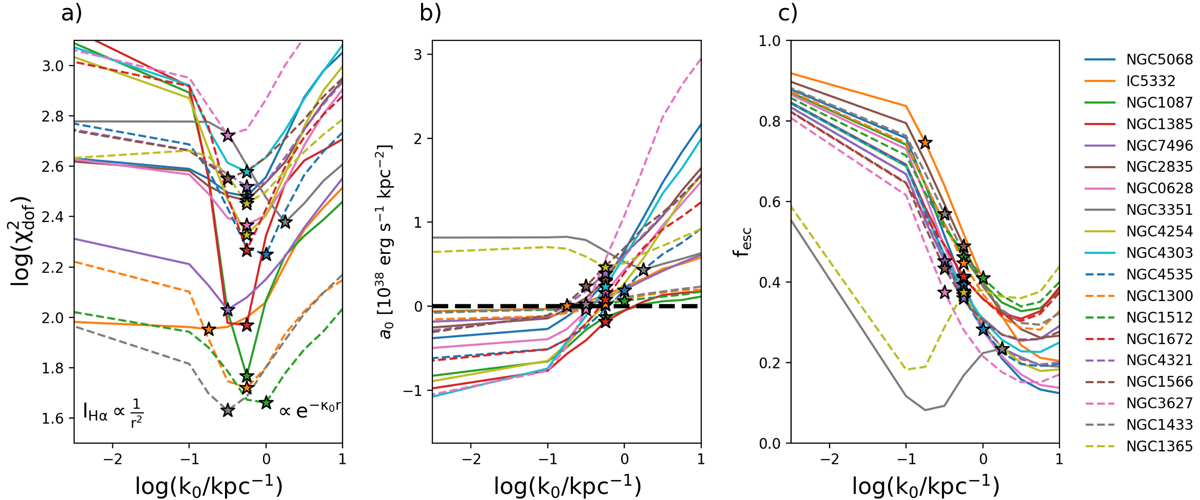
Summary of best-fit model parameters for the DIG leakage model applied to our entire sample. a) Variation in ![]() for the DIG spatial models described in the text as a function of the absorption coefficient, k0, for all the galaxies in our sample. Low values of k0 correspond to the case of spherical dilution, while high values correspond to exponential attenuation with scale length 1/k0. For each galaxy, a coloured star denotes the model with minimum
for the DIG spatial models described in the text as a function of the absorption coefficient, k0, for all the galaxies in our sample. Low values of k0 correspond to the case of spherical dilution, while high values correspond to exponential attenuation with scale length 1/k0. For each galaxy, a coloured star denotes the model with minimum ![]() . b) Value of the additive offset, a0, defined in Eq. (2), as a function of k0. According to the simple model described in the text, a0 ∼ 0. Star symbols correspond to the k0 values with the lowest
. b) Value of the additive offset, a0, defined in Eq. (2), as a function of k0. According to the simple model described in the text, a0 ∼ 0. Star symbols correspond to the k0 values with the lowest ![]() , which are clustered around a0 ∼ 0. c) fesc, the escape fraction of ionising radiation from H II regions as a function of k0 for each galaxy, assuming Δh = 1 kpc. Star symbols correspond to the k0 values with the lowest
, which are clustered around a0 ∼ 0. c) fesc, the escape fraction of ionising radiation from H II regions as a function of k0 for each galaxy, assuming Δh = 1 kpc. Star symbols correspond to the k0 values with the lowest ![]() .
.
Current usage metrics show cumulative count of Article Views (full-text article views including HTML views, PDF and ePub downloads, according to the available data) and Abstracts Views on Vision4Press platform.
Data correspond to usage on the plateform after 2015. The current usage metrics is available 48-96 hours after online publication and is updated daily on week days.
Initial download of the metrics may take a while.