Fig. 6.
Download original image
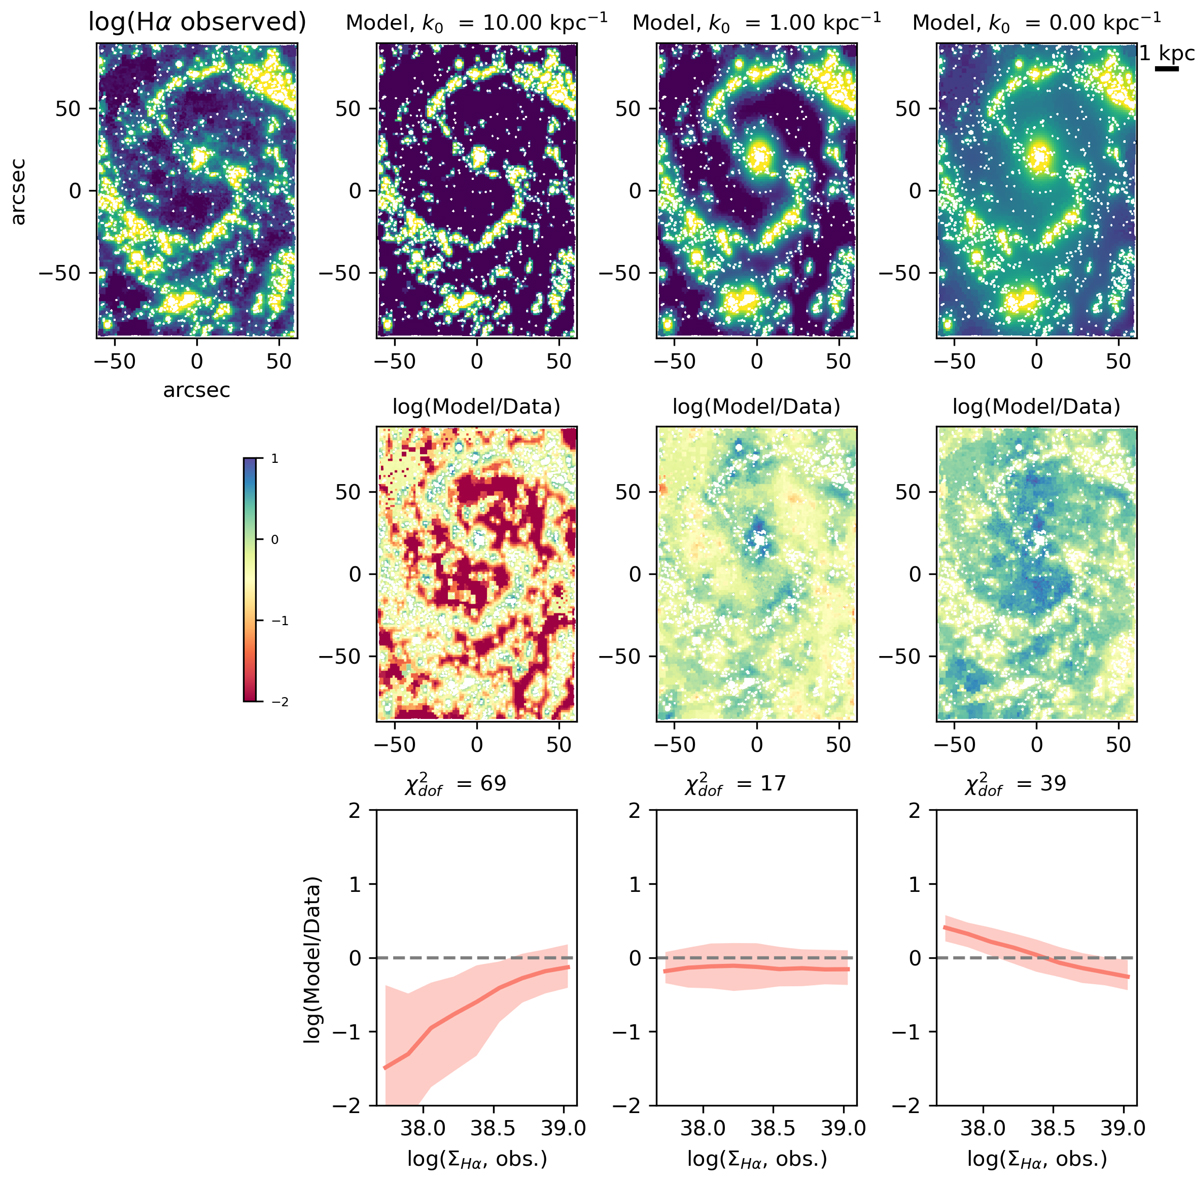
Example of our DIG modelling and its comparison with the observed ΣHα for NGC 4535. Top row: observed Hα flux map (H II regions are masked and appear white in all the maps) and the model predictions for different values of k0, generated according to Eq. (1). Middle row: a spatial comparison of the model and observations, in the form of log(Model/Data). Bottom row: median relation between log(Model/Data) and ΣHα, observed with associated scatter (the shaded region corresponds to the range between the 16th and 84th percentiles). The ![]() for each model is also listed above each panel. The model with k0 ∼ 1 kpc−1 offers a better representation of the data with respect to models with higher (k0 = 10 kpc−1) or lower values (k0 = 0 kpc−1, i.e. only spherical dilution).
for each model is also listed above each panel. The model with k0 ∼ 1 kpc−1 offers a better representation of the data with respect to models with higher (k0 = 10 kpc−1) or lower values (k0 = 0 kpc−1, i.e. only spherical dilution).
Current usage metrics show cumulative count of Article Views (full-text article views including HTML views, PDF and ePub downloads, according to the available data) and Abstracts Views on Vision4Press platform.
Data correspond to usage on the plateform after 2015. The current usage metrics is available 48-96 hours after online publication and is updated daily on week days.
Initial download of the metrics may take a while.