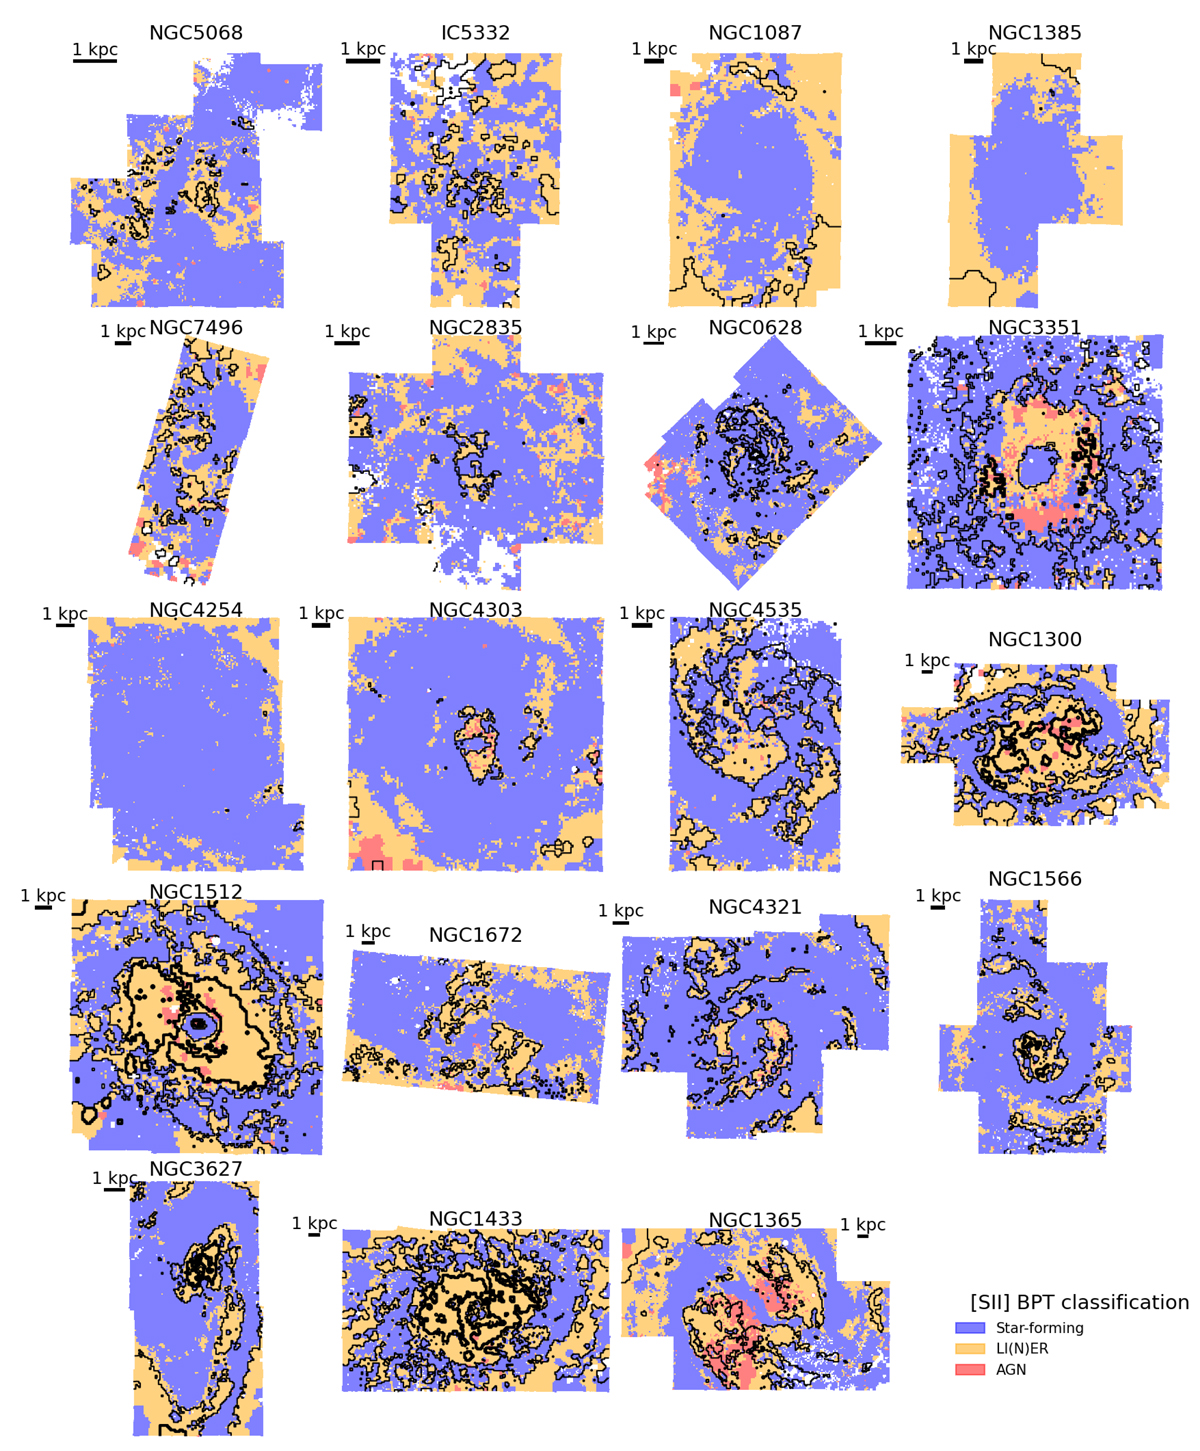
Fig. 5.
Download original image
Maps colour-coded by the position of each region in the [S II] BPT diagram (blue: star formation; orange: LI(N)ER; red: AGN). The classification is performed according to the demarcation lines of Kewley et al. (2001) (to classify star-forming regions) and the AGN-LI(N)ER demarcation line of Kewley et al. (2006). The black contours correspond to EW(Hα) of 1.1 and 3 Å (same as in Fig. 4).
Current usage metrics show cumulative count of Article Views (full-text article views including HTML views, PDF and ePub downloads, according to the available data) and Abstracts Views on Vision4Press platform.
Data correspond to usage on the plateform after 2015. The current usage metrics is available 48-96 hours after online publication and is updated daily on week days.
Initial download of the metrics may take a while.