Fig. 3.
Download original image
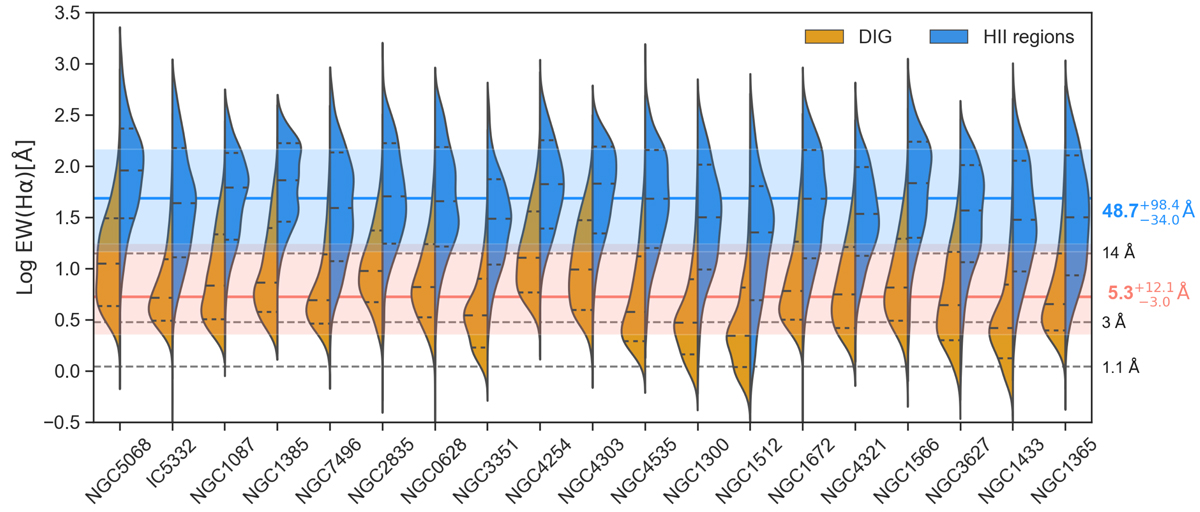
EW(Hα) in H II regions (blue) and DIG (orange) in the PHANGS–MUSE sample. DIG and H II regions are defined according to a morphological criterion (using HIIPHOT; see Sect. 2.3). The 16th, 50th, and 84th percentiles of the distributions are shown with dashed lines on each violin. Dashed horizontal black lines represent demarcations employed in the literature to distinguish H II regions from DIG (3 and 14 Å) and the value of EW(Hα) from HOLMES using the PEGASE models (1.1 Å). The blue and orange horizontal lines (and associated colour-shaded areas) represent the 50th (16th and 84th) percentiles of the EW(Hα) distribution for H II regions and DIG across all galaxies.
Current usage metrics show cumulative count of Article Views (full-text article views including HTML views, PDF and ePub downloads, according to the available data) and Abstracts Views on Vision4Press platform.
Data correspond to usage on the plateform after 2015. The current usage metrics is available 48-96 hours after online publication and is updated daily on week days.
Initial download of the metrics may take a while.