Free Access
Fig. A.1.
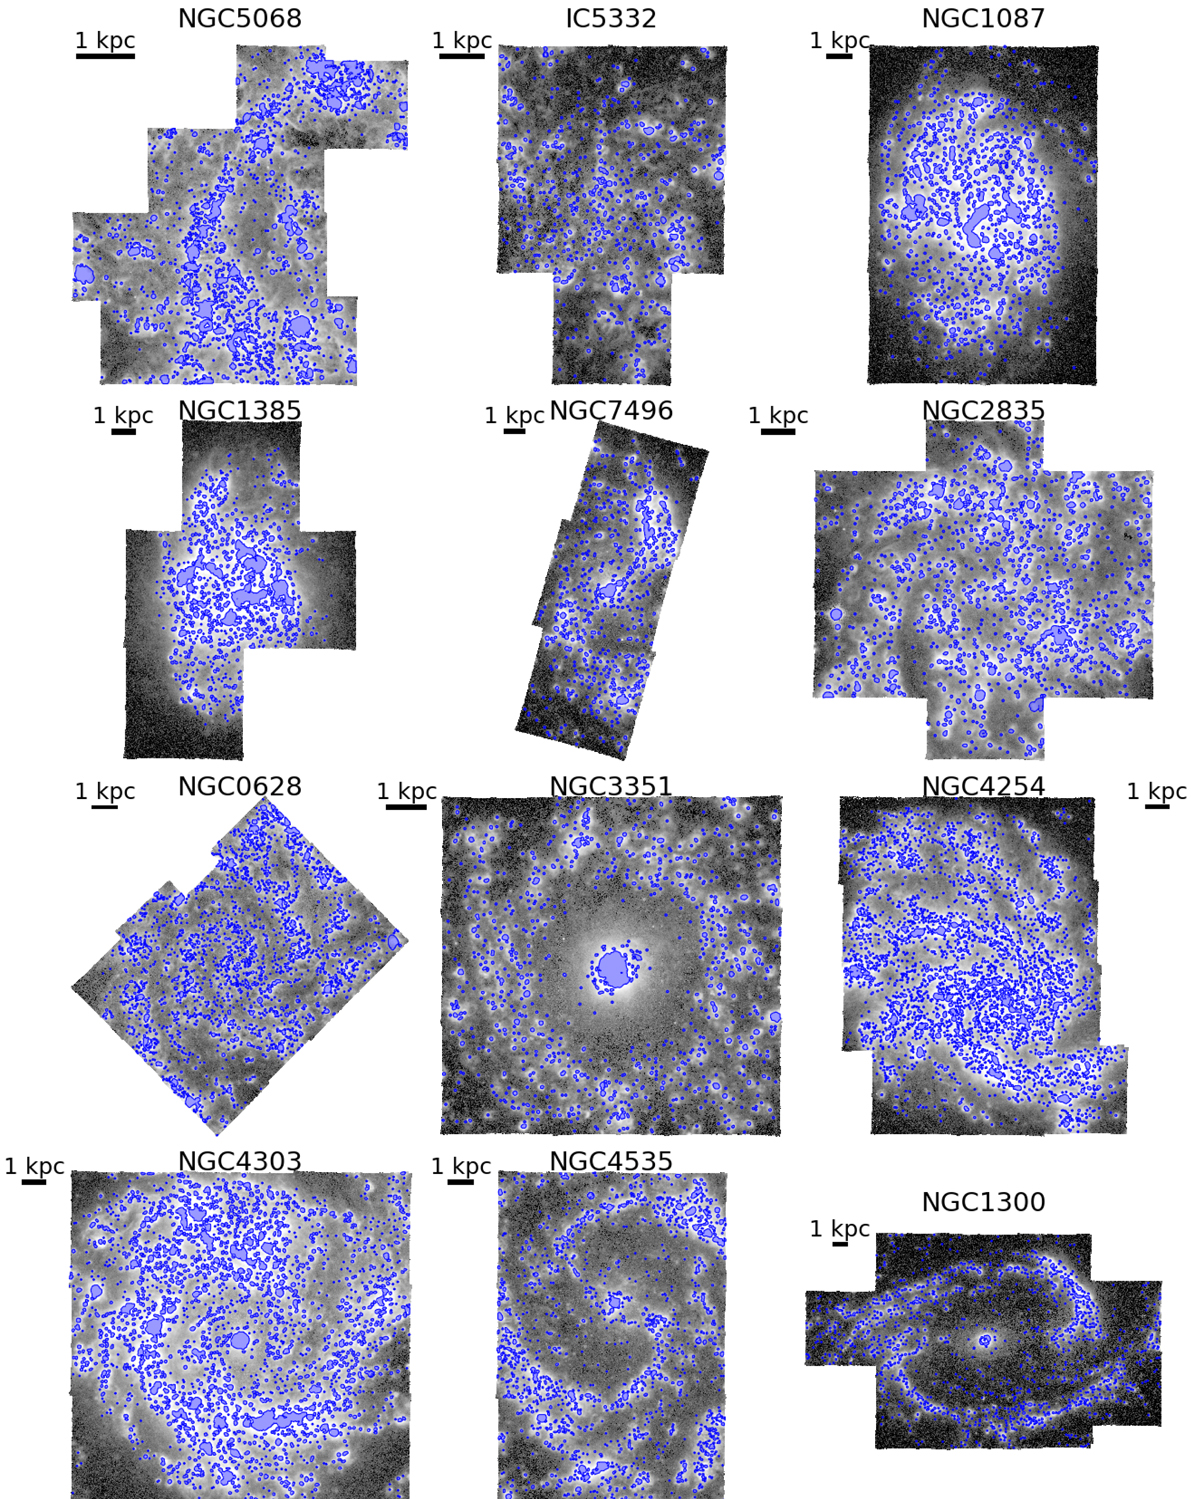
Download original image
Ionised nebula masks (blue) superimposed on the ΣHα maps (grey scale). Galaxies are ordered by increasing stellar mass from top left to bottom right.
Current usage metrics show cumulative count of Article Views (full-text article views including HTML views, PDF and ePub downloads, according to the available data) and Abstracts Views on Vision4Press platform.
Data correspond to usage on the plateform after 2015. The current usage metrics is available 48-96 hours after online publication and is updated daily on week days.
Initial download of the metrics may take a while.