Fig. 17.
Download original image
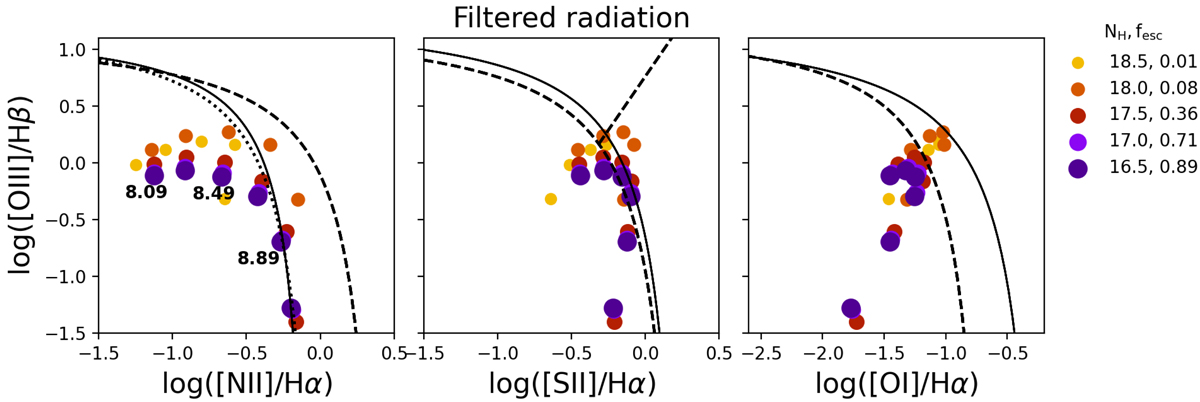
Photoionisation models of clouds illuminated by a hardened radiation field leaking from H II regions in the [N II] BPT (left), [S II] BPT (middle), and [O I] BPT (right) diagrams. The input spectrum is a 2 Myr SSP, which has been transmitted from a density-bounded H II region. We consider H II regions with a range of hydrogen column densities (NH, reported in the legend). The legend also shows the escape fraction from the H II region corresponding to each column density value. All models shown have log U0 = −3.5 and varying metallicity (three representative metallicities are labelled in the left panel to demonstrate that metallicity generally increases along the x axis). Demarcation lines from the literature are shown as dashed (Kewley et al. 2001, 2006), dotted (Kauffmann et al. 2003), and solid black lines (Law et al. 2021).
Current usage metrics show cumulative count of Article Views (full-text article views including HTML views, PDF and ePub downloads, according to the available data) and Abstracts Views on Vision4Press platform.
Data correspond to usage on the plateform after 2015. The current usage metrics is available 48-96 hours after online publication and is updated daily on week days.
Initial download of the metrics may take a while.