Fig. 16.
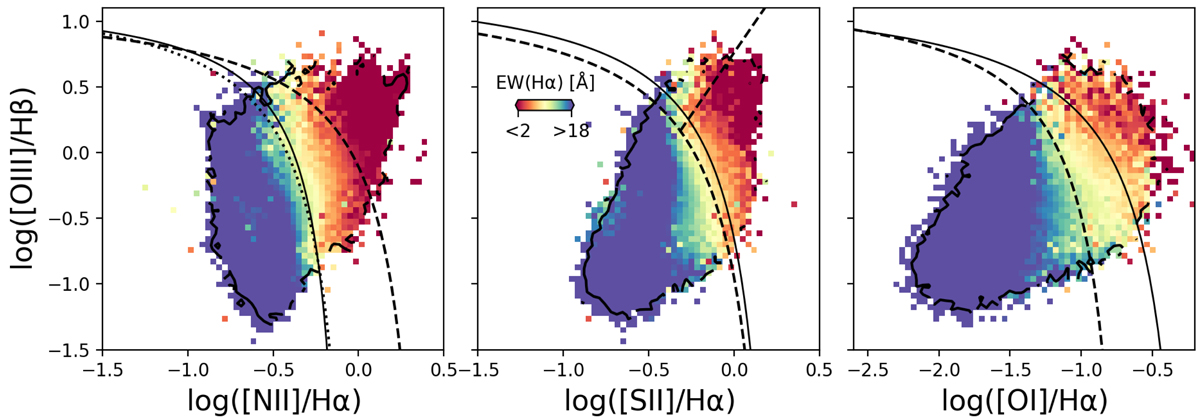
Download original image
Position of the DIG regions in our sample in the [N II] BPT (left), [S II] BPT (middle), and [O I] BPT (right) colour-coded by the median EW(Hα). We excluded NGC 1365 because of its prominent AGN cone. Demarcation lines from the literature are shown as dashed (Kewley et al. 2001, 2006), dotted (Kauffmann et al. 2003), and solid black lines (Law et al. 2021). The colour bar for EW(Hα) highlights the transition region between the 16th and 84th percentiles of the EW(Hα) distribution of all regions.
Current usage metrics show cumulative count of Article Views (full-text article views including HTML views, PDF and ePub downloads, according to the available data) and Abstracts Views on Vision4Press platform.
Data correspond to usage on the plateform after 2015. The current usage metrics is available 48-96 hours after online publication and is updated daily on week days.
Initial download of the metrics may take a while.