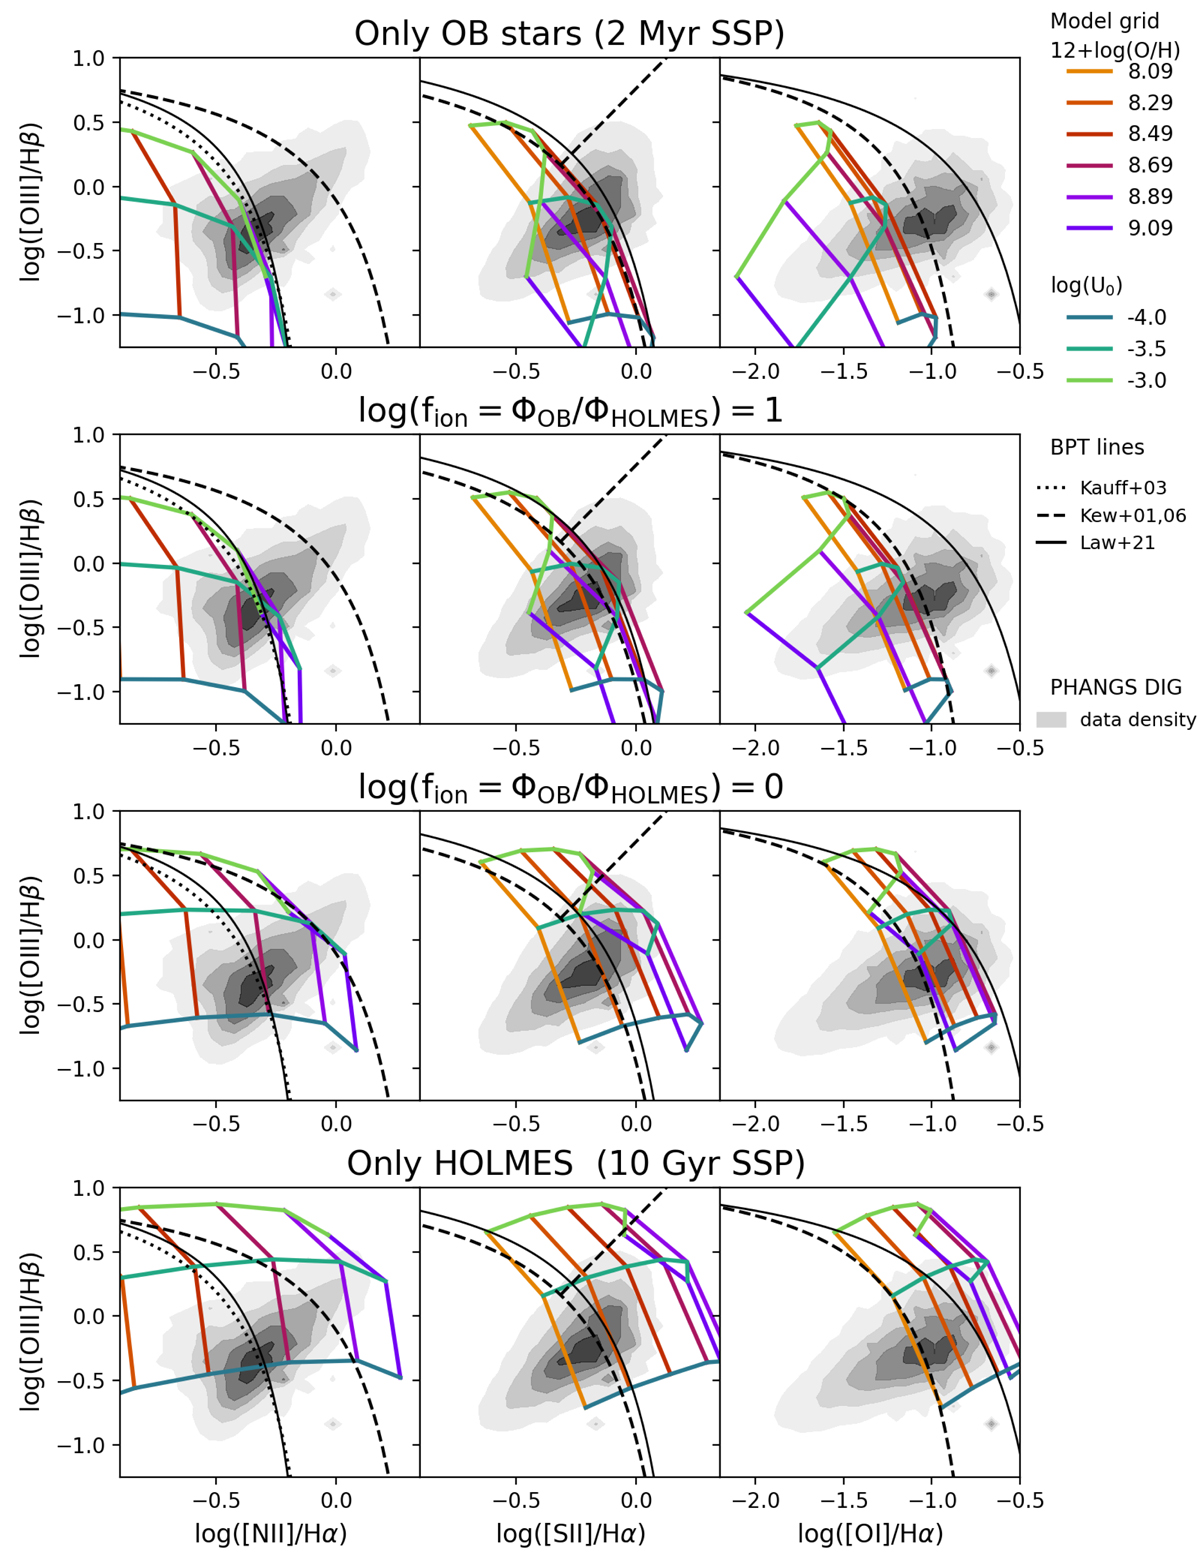
Fig. 15.

Download original image
Position in the [N II] BPT (left), [S II] BPT (middle), and [O I] BPT (right) of photoionisation models with varying fion = ΦOB/ΦHOLMES. We show models for different metallicity and log(U0) = [−4.0, −3.5, −3.0], with colours given in the legend. Top row: models where the input spectrum includes only OB stars (2 Myr SSP), while in the bottom row the input spectrum only includes old stars (10 Gyr model). Two middle rows: illustrate the effect of a decreasing contribution from OB stars to the line ratios in the BPT diagram. Demarcation lines from the literature are shown as dashed (Kewley et al. 2001, 2006), dotted (Kauffmann et al. 2003), and solid black lines (Law et al. 2021). The grey contours represent the locus of the DIG regions from the galaxies in the PHANGS–MUSE sample (the lowest contour encloses 10% of the data, and successive contours are in steps of 20%). The comparison shows that adding a varying contribution of HOLMES allows all the line ratios observed in the DIG to be broadly covered.
Current usage metrics show cumulative count of Article Views (full-text article views including HTML views, PDF and ePub downloads, according to the available data) and Abstracts Views on Vision4Press platform.
Data correspond to usage on the plateform after 2015. The current usage metrics is available 48-96 hours after online publication and is updated daily on week days.
Initial download of the metrics may take a while.


