Fig. 14.

Download original image
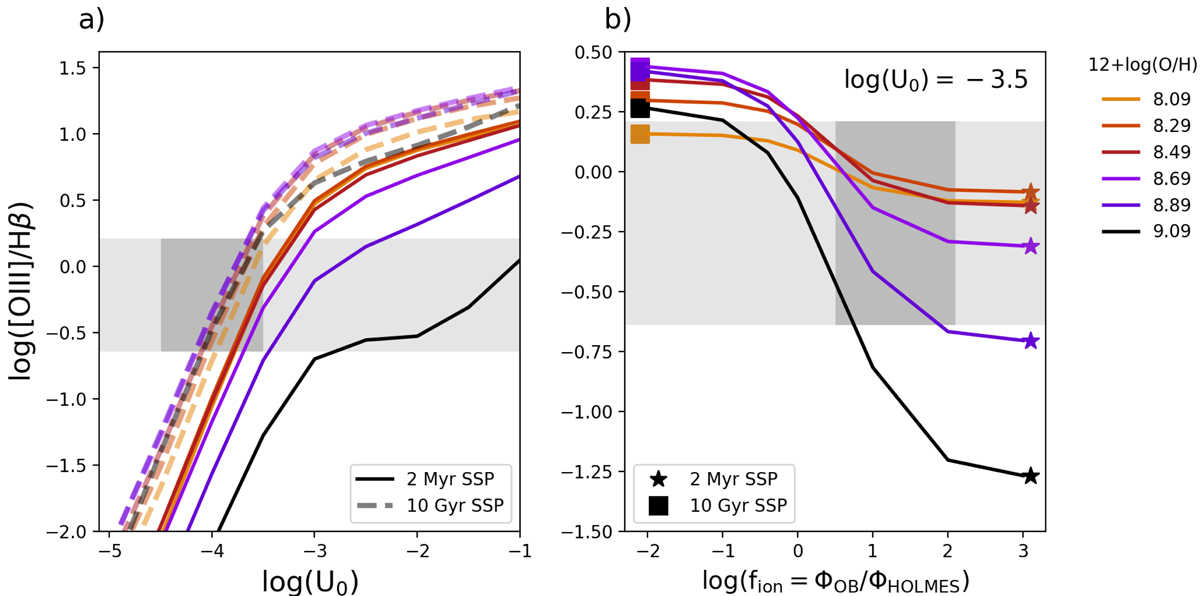
Model predictions for the [O III]/Hβ line ratio considering both young stars and HOLMES. a) Model predictions for photoionised clouds, computed with CLOUDY and a 2 Myr (solid lines) and a 10 Gyr (dashed lines) SSP spectrum. The line ratio log([O III]/Hβ) is plotted as a function of the ionisation parameter at the incident face of the cloud (log(U0)). The vertical extent of the grey area highlights the range of line ratios observed in the DIG in the PHANGS–MUSE data. Different colours correspond to different gas-phase metallicities, with the same colour-coding in both panels, as indicated in the legend. All models predict log([O III]/Hβ) to increase with ΣHα, in contrast to what is observed. b) Model predictions for the log([O III]/Hβ) line ratio as a function of the fraction of the ionising radiation originating from old stars, fion = ΦOB/ΦHOLMES. We show models for a fixed value of log(U0) = − 3.5 and different metallicities. The horizontal light grey band corresponds to the range of values of log([O III]/Hβ) observed in the DIG of our sample, while the dark grey box corresponds to the range of fion observed in the PHANGS data. fion is estimated by computing the ionising photons expected to be produced by HOLMES given the local stellar mass surface density.
Current usage metrics show cumulative count of Article Views (full-text article views including HTML views, PDF and ePub downloads, according to the available data) and Abstracts Views on Vision4Press platform.
Data correspond to usage on the plateform after 2015. The current usage metrics is available 48-96 hours after online publication and is updated daily on week days.
Initial download of the metrics may take a while.


