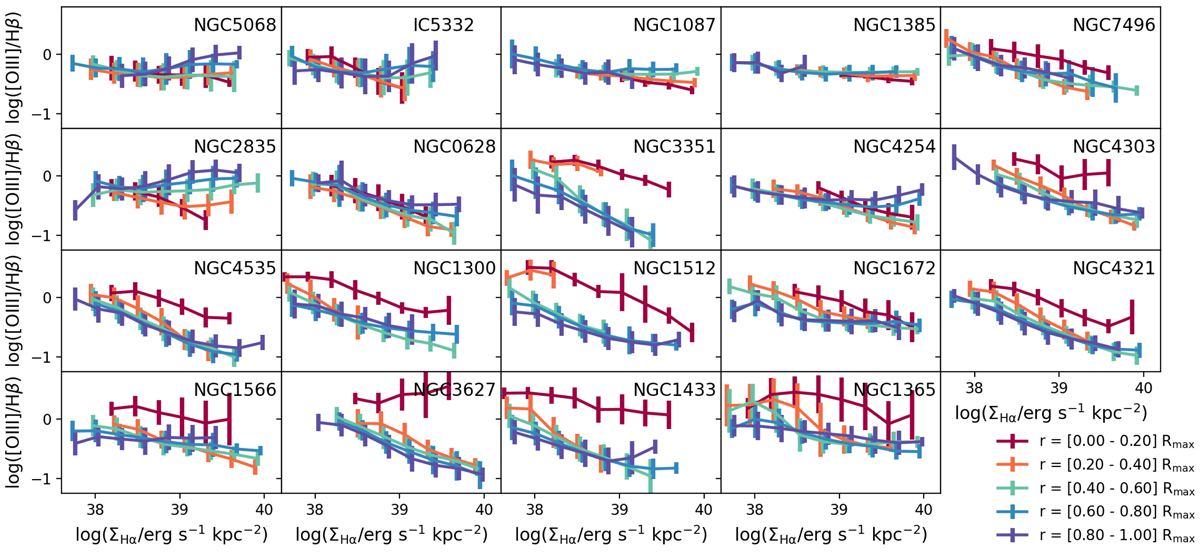
Fig. 13.
Download original image
Log([O III]/Hβ) in the DIG as a function of log(ΣHα/erg s−1 kpc−2) for different radial bins for individual galaxies in the PHANGS–MUSE sample. Galaxies are ordered by stellar mass from lowest (top left) to highest (bottom right). Several galaxies (NGC 3351, NGC 1300, NGC 1512, NGC 3627, NGC 1433, and NGC 1365) show exceptionally high line ratio values in their central regions (in red). Galaxies present a systematic change in the slope of the log([O III]/Hβ) versus ΣHα relation, with low-mass galaxies showing comparable line ratios at low and high ΣHα and high-mass galaxies showing a clear decrease in log([O III]/Hβ) with ΣHα. Both of these trends are at odds with predictions from photoionisation models.
Current usage metrics show cumulative count of Article Views (full-text article views including HTML views, PDF and ePub downloads, according to the available data) and Abstracts Views on Vision4Press platform.
Data correspond to usage on the plateform after 2015. The current usage metrics is available 48-96 hours after online publication and is updated daily on week days.
Initial download of the metrics may take a while.