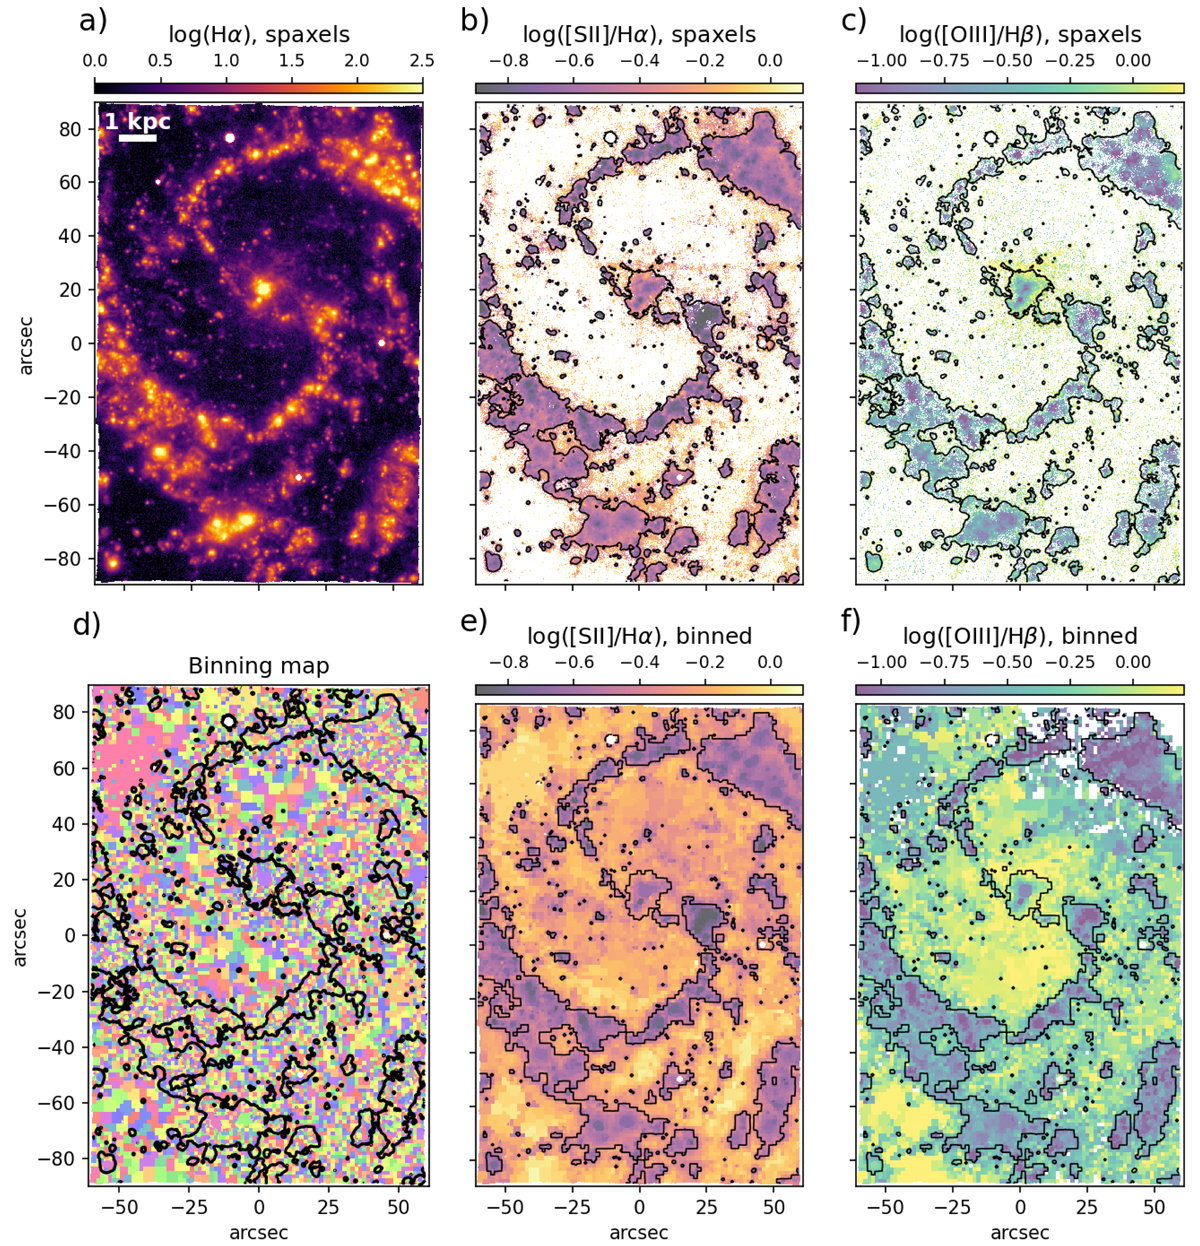
Fig. 1.
Download original image
Maps of the Hα flux, binning scheme, and key line ratios for individual spaxels and after Voronoi binning in NGC 4535. a) Map of log(Hα/10−17 erg s−1 cm−2 arcsec−2), at the native 0.2″ single-spaxel resolution. The circular areas that appear white in this and other panels are locations of masked foreground stars. b) Map of log([S II]/Hα) at single-spaxel resolution. White areas have S/N < 3 for the relevant emission lines. The black contour corresponds to ΣHα = 8 × 10⁻¹⁷ erg s−1 cm−2 arcsec−2 or about a 16σ detection for Hα. c) Same as b) but for the log([O III]/Hβ) ratio. d) Representation of the Voronoi binning scheme adopted to recover the low-surface-brightness line emission in the DIG, as described in the text. Each bin is assigned a random colour. e) Map of log([S II]/Hα) using the binned data. f) Same as e) but for the log([O III]/Hβ) ratio.
Current usage metrics show cumulative count of Article Views (full-text article views including HTML views, PDF and ePub downloads, according to the available data) and Abstracts Views on Vision4Press platform.
Data correspond to usage on the plateform after 2015. The current usage metrics is available 48-96 hours after online publication and is updated daily on week days.
Initial download of the metrics may take a while.