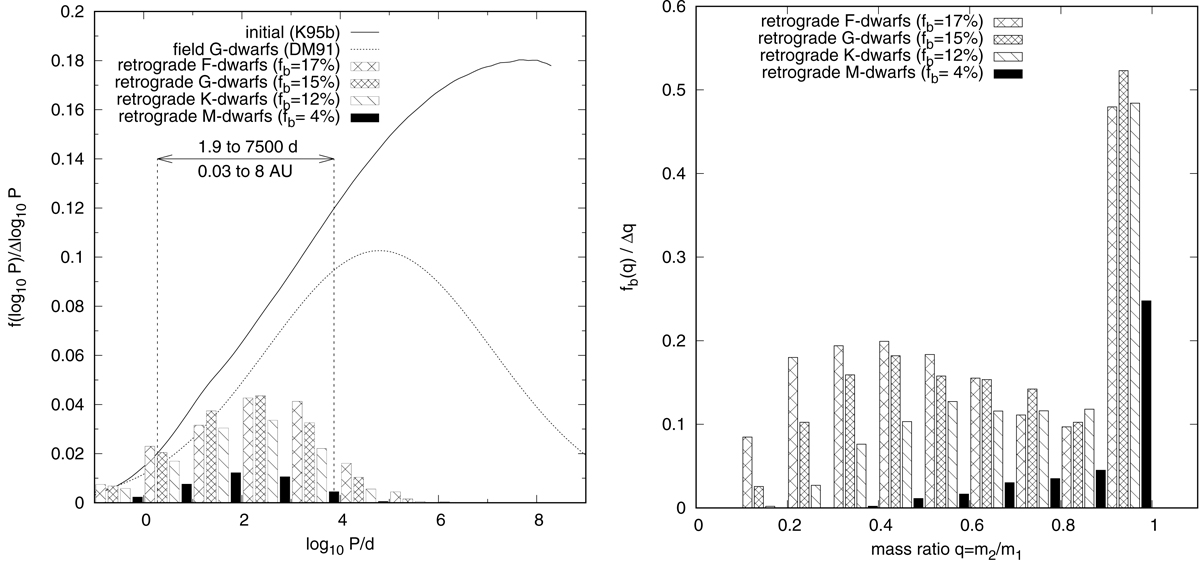
Fig. 3.
Download original image
Prediction of the binary period distribution (left panel) and mass-ratio distribution (right panel) for field F, G, K and M dwarfs on retrograde orbits. Expected binary fractions over the whole period range depend on spectral type and are indicated in the key. Every four neighbouring histogram bars with different filling patterns are in the same bin, whose centre is located in the middle between two integers in log10P/d. For example, the centre of each of the four bars between log10P/d = 2 and 3 is located at log10P/d = 2.5 but is shifted against the others for the sake of visibility. While all sub-populations share the same initial period distribution (left panel, solid line), a common initial distribution for the mass ratio cannot be shown here since its shape depends on the spectral type (e.g. rising for M dwarfs over the whole q range but declining for F and G dwarfs for q ⪆ 0.4; Marks & Kroupa 2011). Thus, for example, ≈1% of all M dwarfs in the retrograde population are binaries with log10P/d = 2 − 3 (left panel, black filled bar). All the retrograde M-dwarf binaries have a mass-ratio distribution shown by the black histogram in the right panel.
Current usage metrics show cumulative count of Article Views (full-text article views including HTML views, PDF and ePub downloads, according to the available data) and Abstracts Views on Vision4Press platform.
Data correspond to usage on the plateform after 2015. The current usage metrics is available 48-96 hours after online publication and is updated daily on week days.
Initial download of the metrics may take a while.