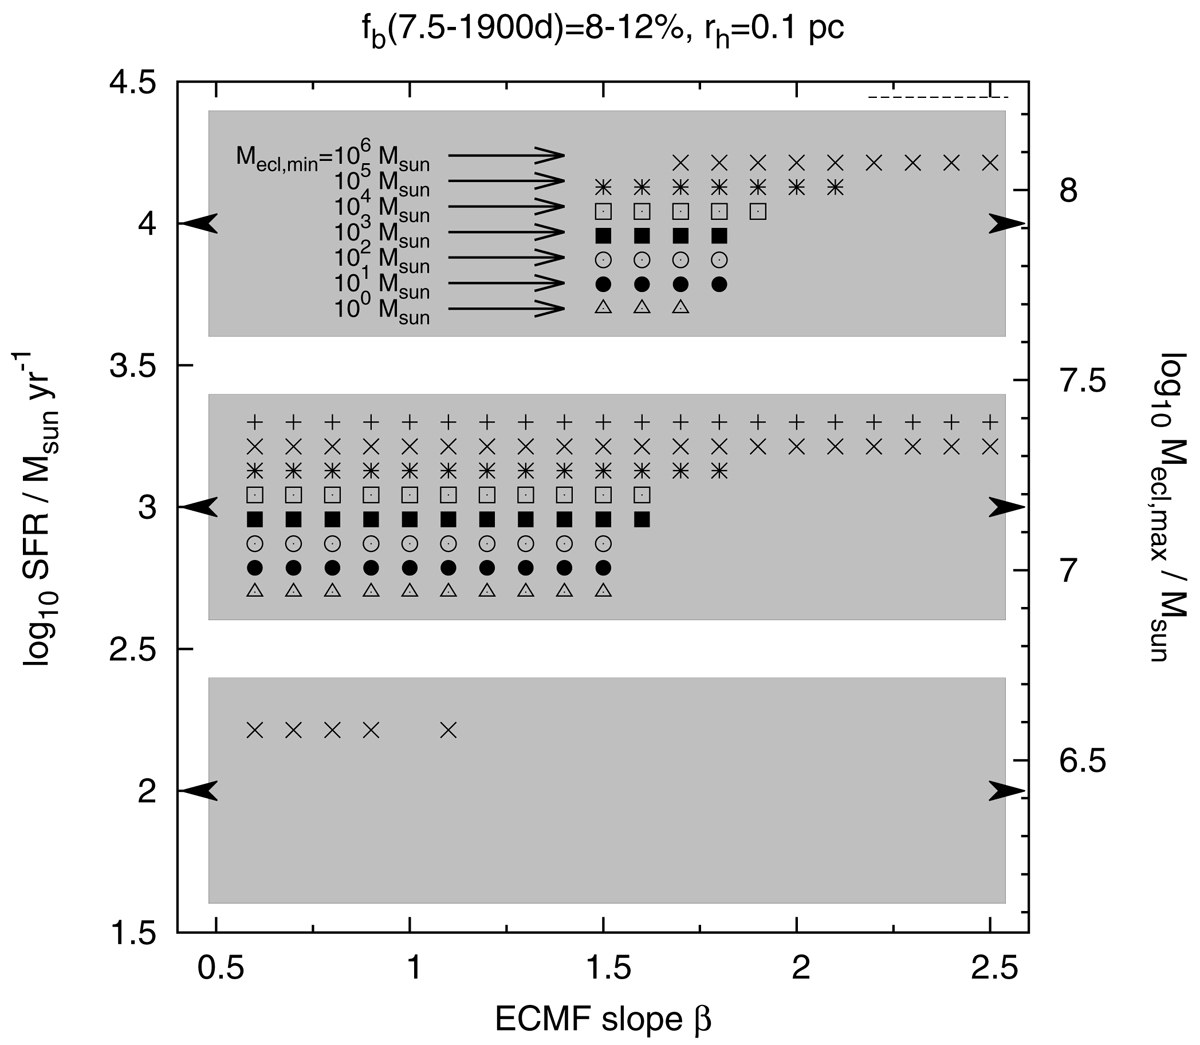
Fig. 2.
Download original image
Each symbol in the SFR vs. ECMF slope β (Eq. (2)) plane corresponds to a solution that reproduces the low binary fraction for the retrograde stellar population if typical star cluster half-mass radii were only rh = 0.1 pc. All symbols inside one of the grey boxes have the SFR indicated by the arrow on the left of each box. Each row of symbols in a box corresponds to the minimum mass of the cluster (Mecl, min) that was able to form. The SFRs on the left ordinate correspond to a maximum cluster mass, Mecl, max, on the right ordinate using Eq. (3). The binary fraction for the retrograde population is ≈10% if the SFR in the ω Cen galaxy was large, the ECMF has been top-heavy (low β), and low-mass star cluster formation was suppressed (large Mecl, min).
Current usage metrics show cumulative count of Article Views (full-text article views including HTML views, PDF and ePub downloads, according to the available data) and Abstracts Views on Vision4Press platform.
Data correspond to usage on the plateform after 2015. The current usage metrics is available 48-96 hours after online publication and is updated daily on week days.
Initial download of the metrics may take a while.