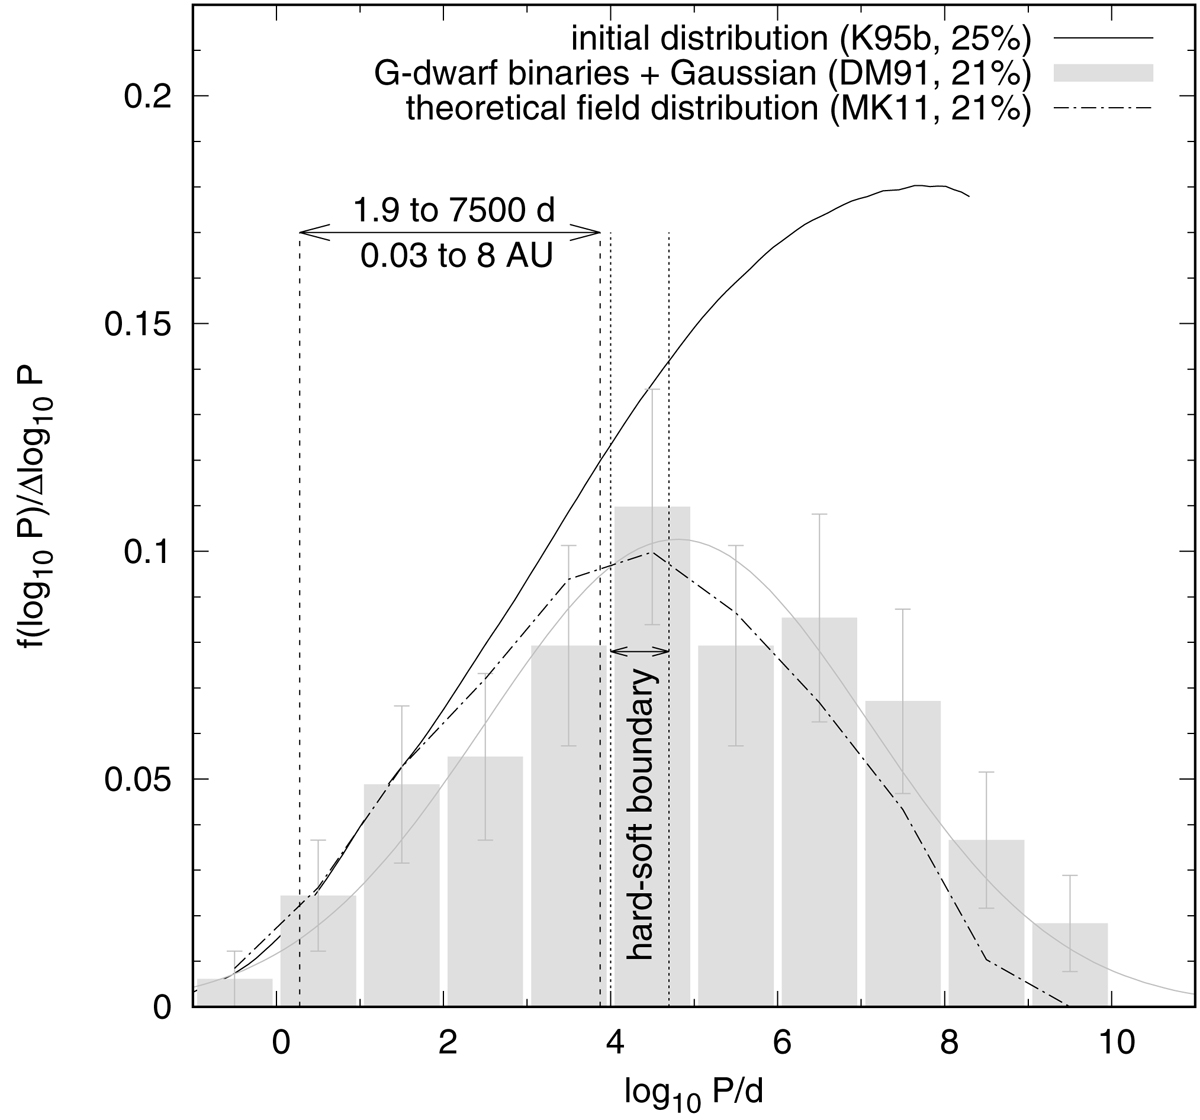
Fig. 1.
Download original image
Initial period distribution in star clusters (solid line; Kroupa 1995b,c), the observed field G dwarf (grey histogram plus Gaussian distribution; Duquennoy & Mayor 1991), and a theoretical binary period distribution for Galactic G dwarfs (dash-dotted line; Marks & Kroupa 2011). The period range between the dashed lines is the range of binary periods accessible in the spectroscopic survey by Carney et al. (2005). The percentages in the legend show the binary fraction within this range for the respective distribution. The region between the dotted lines is the location of the hard-soft boundary for a typical present-day GC (M = 105 M⊙, rh = 3 pc; see Sect. 2.2). We note that f(log10P) = Nb(log10P)/Ncms, where Nb(log10P) denotes the number of binaries in the orbital period bin log10P.
Current usage metrics show cumulative count of Article Views (full-text article views including HTML views, PDF and ePub downloads, according to the available data) and Abstracts Views on Vision4Press platform.
Data correspond to usage on the plateform after 2015. The current usage metrics is available 48-96 hours after online publication and is updated daily on week days.
Initial download of the metrics may take a while.