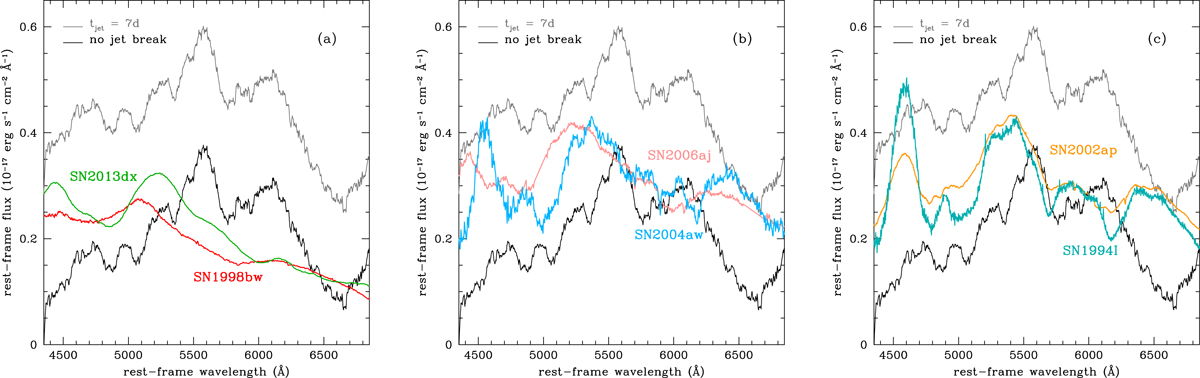
Fig. 4.
Download original image
Comparison between SN 2019jrj spectra and other GRB SNe. (a) Spectra of SN 2019jrj at maximum light obtained under the assumptions of a jet break at 7 rest-frame days (grey upper curve) or no break (black lower curve) and corrected for Galactic reddening (E(B − V)Gal ≈ 0.013 mag; Schlafly & Finkbeiner 2011) and line-of-sight reddening at the source (E(B − V) = 0.3 mag). For comparison, maximum-light spectra of the GRB SNe 1998bw (Patat et al. 2001) and 2013dx (D’Elia et al. 2015; Mazzali et al. 2021) are shown. These are de-reddened for Galactic extinction, reduced to the rest frame, and scaled in flux to match the SN 2019jrj flux level. (b) Same as in panel a, but compared with maximum-light spectra of the core-collapse Type Ic SNe 2004aw (Taubenberger et al. 2006) and 2006aj (associated with an X-ray flash; Pian et al. 2006; Mazzali et al. 2006). (c) Same as in panel a, but compared with maximum-light spectra of the core-collapse Type Ic SNe 1994I (Filippenko et al. 1995; Foley et al. 2003) and 2002ap (Mazzali et al. 2002; Foley et al. 2003).
Current usage metrics show cumulative count of Article Views (full-text article views including HTML views, PDF and ePub downloads, according to the available data) and Abstracts Views on Vision4Press platform.
Data correspond to usage on the plateform after 2015. The current usage metrics is available 48-96 hours after online publication and is updated daily on week days.
Initial download of the metrics may take a while.