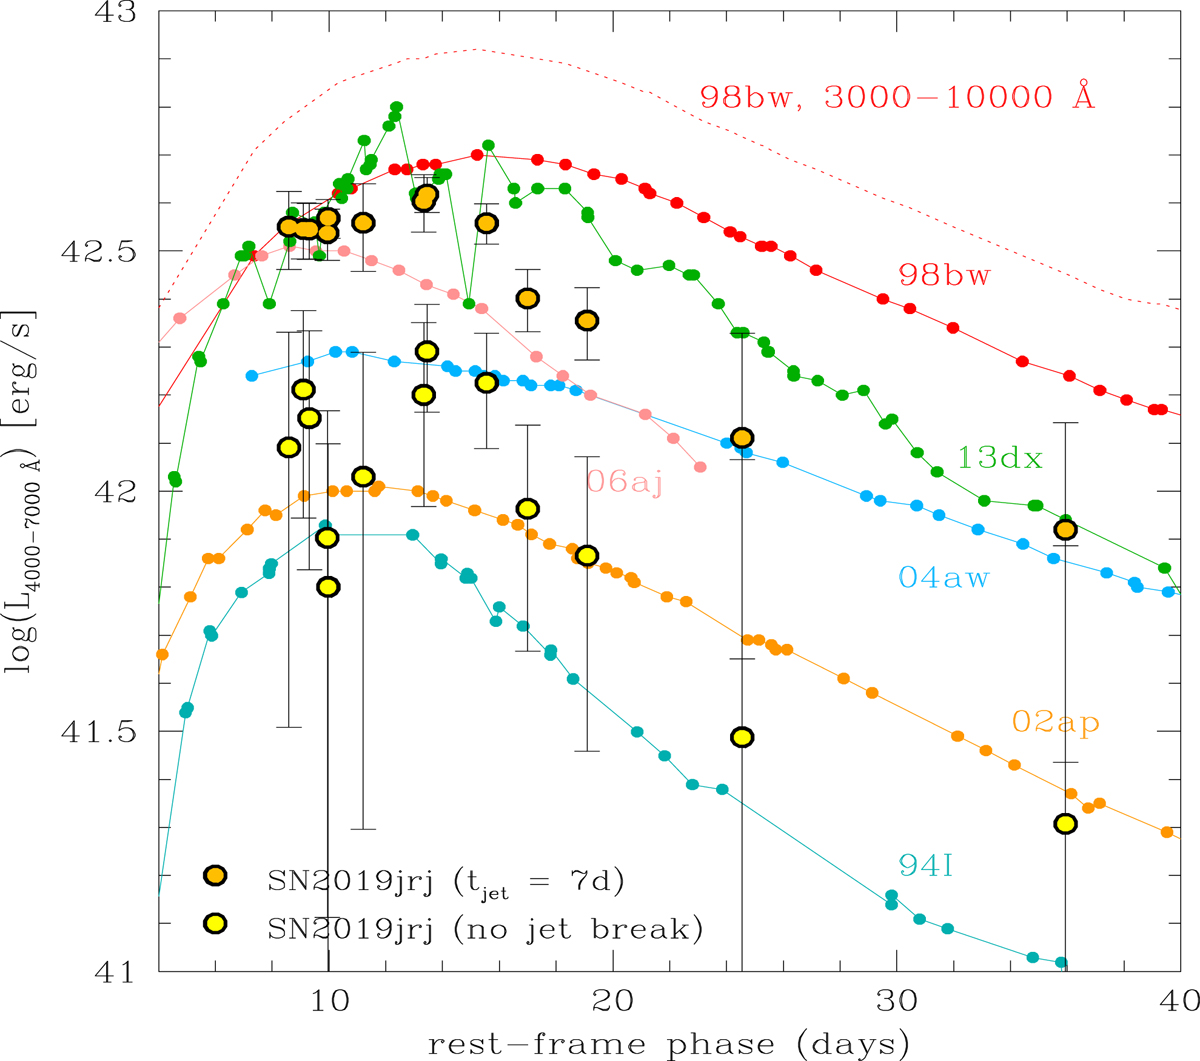
Fig. 3.
Download original image
Light curves of SN 2019jrj computed in the 4000–7000 Å range under the assumptions that a jet break occurs at 7 rest-frame days or does not occur until at least several months after the GRB. The light curves of other core-collapse SNe computed in the same wavelength range from available photometry (Galama et al. 1998; McKenzie & Schaefer 1999; Patat et al. 2001; D’Elia et al. 2015; Toy et al. 2016; Mazzali et al. 2021; Pian et al. 2006; Ferrero et al. 2006; Taubenberger et al. 2006; Foley et al. 2003; Tomita et al. 2006) are shown, as is the light curve of SN 1998bw in the 3000–10 000 Å range (dotted red curve). For clarity, uncertainties are shown only for SN 2019jrj.
Current usage metrics show cumulative count of Article Views (full-text article views including HTML views, PDF and ePub downloads, according to the available data) and Abstracts Views on Vision4Press platform.
Data correspond to usage on the plateform after 2015. The current usage metrics is available 48-96 hours after online publication and is updated daily on week days.
Initial download of the metrics may take a while.