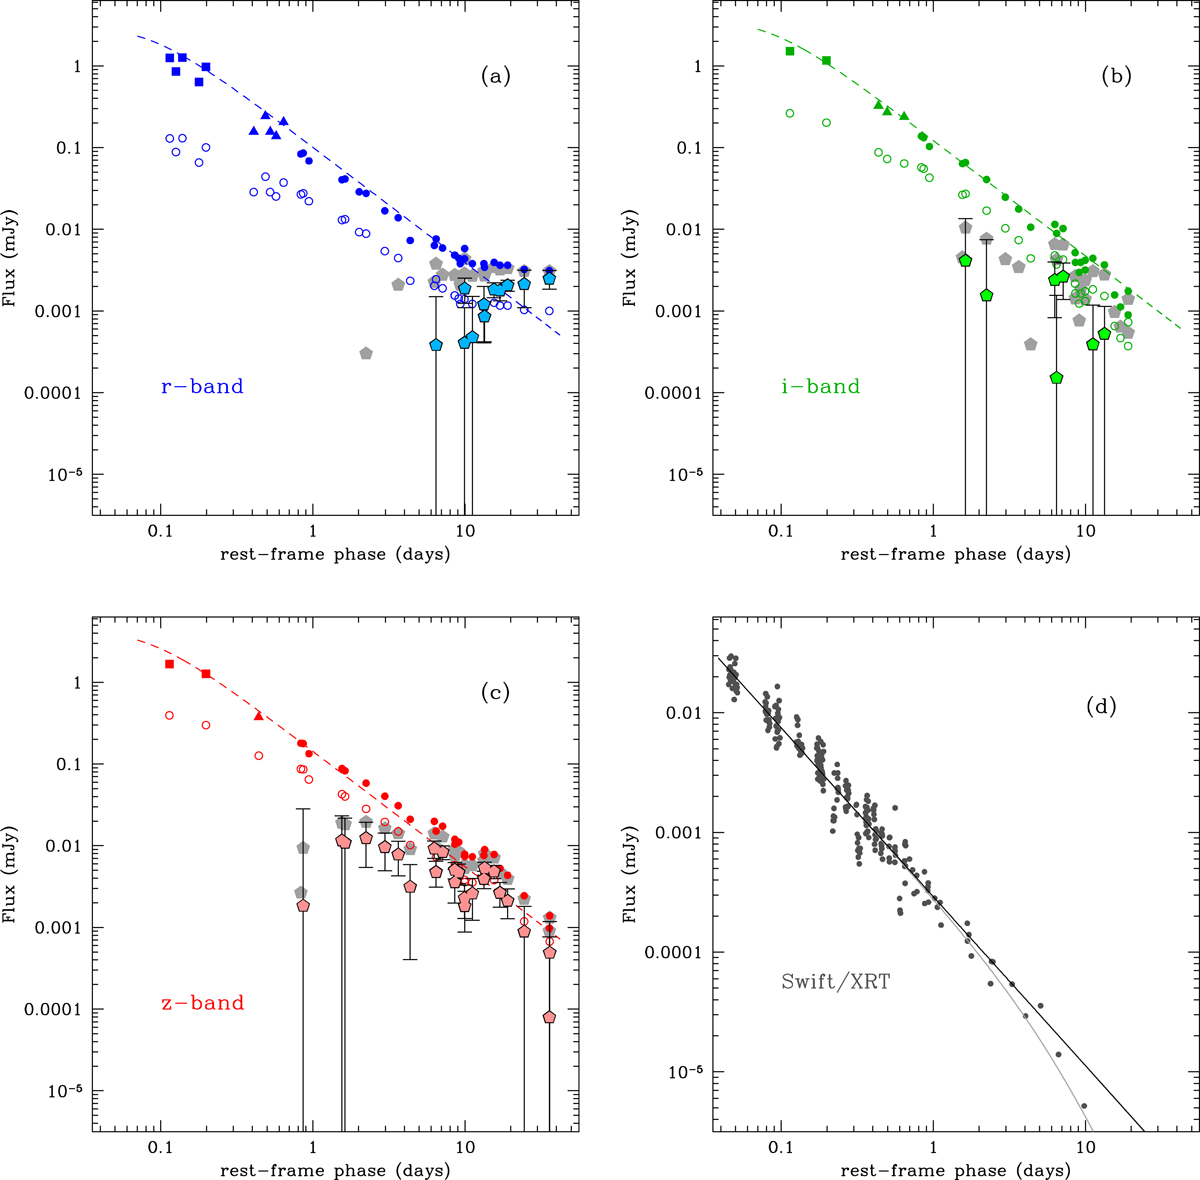
Fig. 2.
Download original image
Optical, NIR and X-rays light curves of GRB 190114C. (a) Light curves of the GRB 190114C counterpart in the optical r band (open blue circles). All fluxes were corrected for host-galaxy contribution, Galactic extinction, and redshift (but not K-corrected). A correction for dust absorption along the GRB line of sight in its host galaxy was also applied (E(B − V) = 0.6 mag, phase < 0.3 day, filled squares; E(B − V) = 0.45 mag, 0.3 < phase < 0.7 day, filled triangles; E(B − V) = 0.3 mag, phase > 0.7 day, filled circles). The synchrotron model with no jet break (t−1.4) is shown as a dashed blue curve at optical wavelengths, and the corresponding SN component is represented by light blue pentagons. If a jet break occurs at 7 days, the SN component is shown as grey pentagons. (b) Same as (a) for the NIR i band. Galaxy-subtracted points are in dark green and the SN points in light green. (c) Same as (a) for the NIR z band. Galaxy-subtracted points are in red and the SN points in pink. (d) Light curves of the GRB 190114C counterpart in X-rays (0.3–10 keV Swift/XRT data, dark grey filled circles). The synchrotron model with no jet break (t−1.4) is shown as a solid black curve. If a jet break occurs at 7 days, the X-ray synchrotron model is shown as a solid grey curve. For clarity, uncertainties on data points were omitted.
Current usage metrics show cumulative count of Article Views (full-text article views including HTML views, PDF and ePub downloads, according to the available data) and Abstracts Views on Vision4Press platform.
Data correspond to usage on the plateform after 2015. The current usage metrics is available 48-96 hours after online publication and is updated daily on week days.
Initial download of the metrics may take a while.