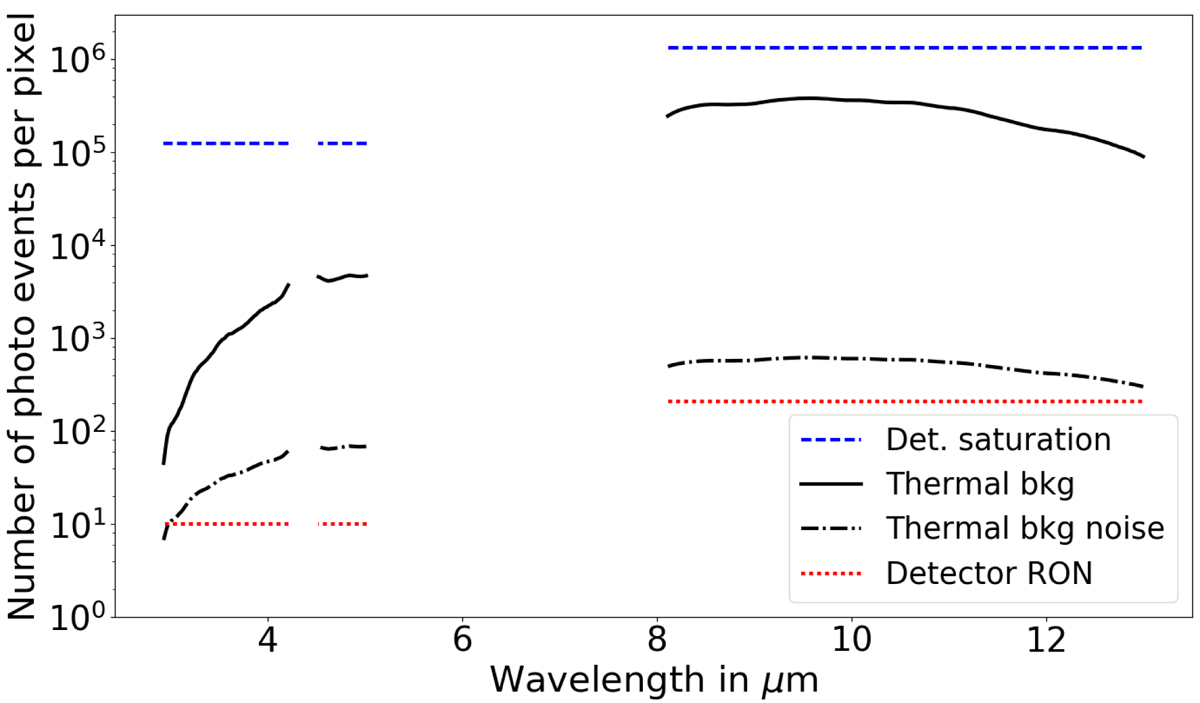
Fig. 3.
Download original image
Comparison between the level of the thermal background (solid black line), the detector saturation limit (blue dashed line), the detector read out noise (red dotted line), and the thermal background noise (black dash-dotted line). These values are obtained in LOW spectral resolution. In the L and M bands, the DIT is 125 ms and in the N band the DIT is 20 ms. In the L band, the DIT is limited by the coherence time. In the N band, the background level implies short DITs to avoid detector saturation.
Current usage metrics show cumulative count of Article Views (full-text article views including HTML views, PDF and ePub downloads, according to the available data) and Abstracts Views on Vision4Press platform.
Data correspond to usage on the plateform after 2015. The current usage metrics is available 48-96 hours after online publication and is updated daily on week days.
Initial download of the metrics may take a while.