Fig. 29.
Download original image
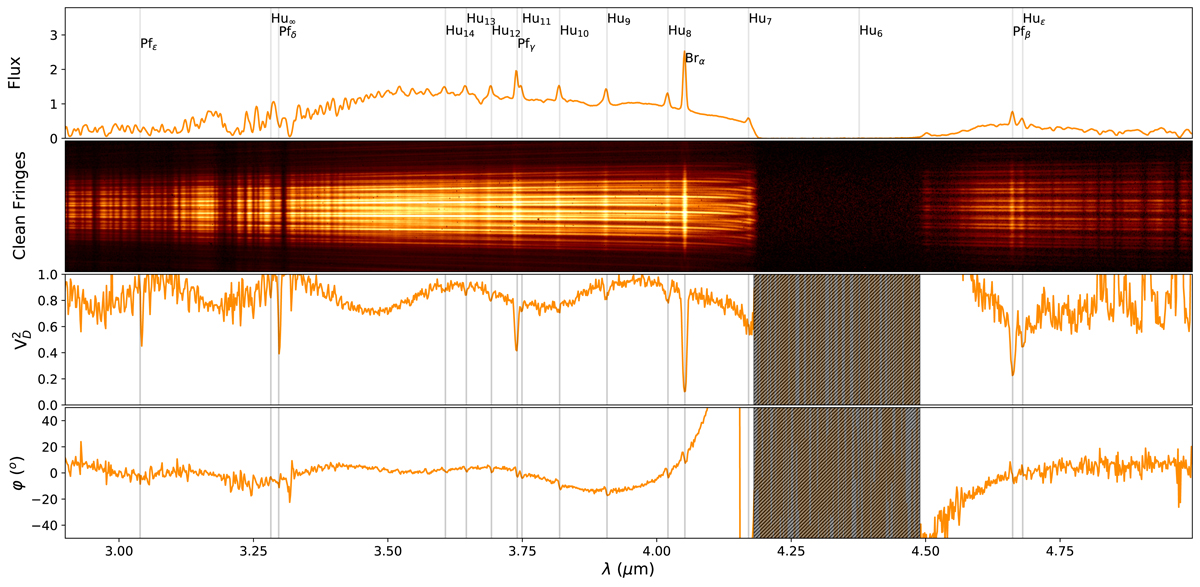
L\AMP M bands medium resolution (R ∼ 500) observation of the Be binary δ Cen obtained in GRA4MAT mode. From top to bottom: source spectrum, cleaned 10 s frame (i.e. with the mean sky removed) in the interferometric channel, differential squared visibility for one of the six baselines, and corresponding differential phase. The gap between the L and M band is shown in grey in the visibility and phase plots. The source spectrum shows a rich collection of hydrogen emission lines in Brα and the Humphrey and Pfund series. The interferometric channel of MATISSE composed of straight and stable high contrast fringes from 2.9 to 4.9 μm shows a collection of bright source emission lines and dark telluric absorption lines.
Current usage metrics show cumulative count of Article Views (full-text article views including HTML views, PDF and ePub downloads, according to the available data) and Abstracts Views on Vision4Press platform.
Data correspond to usage on the plateform after 2015. The current usage metrics is available 48-96 hours after online publication and is updated daily on week days.
Initial download of the metrics may take a while.