Open Access
Fig. 26.
Download original image
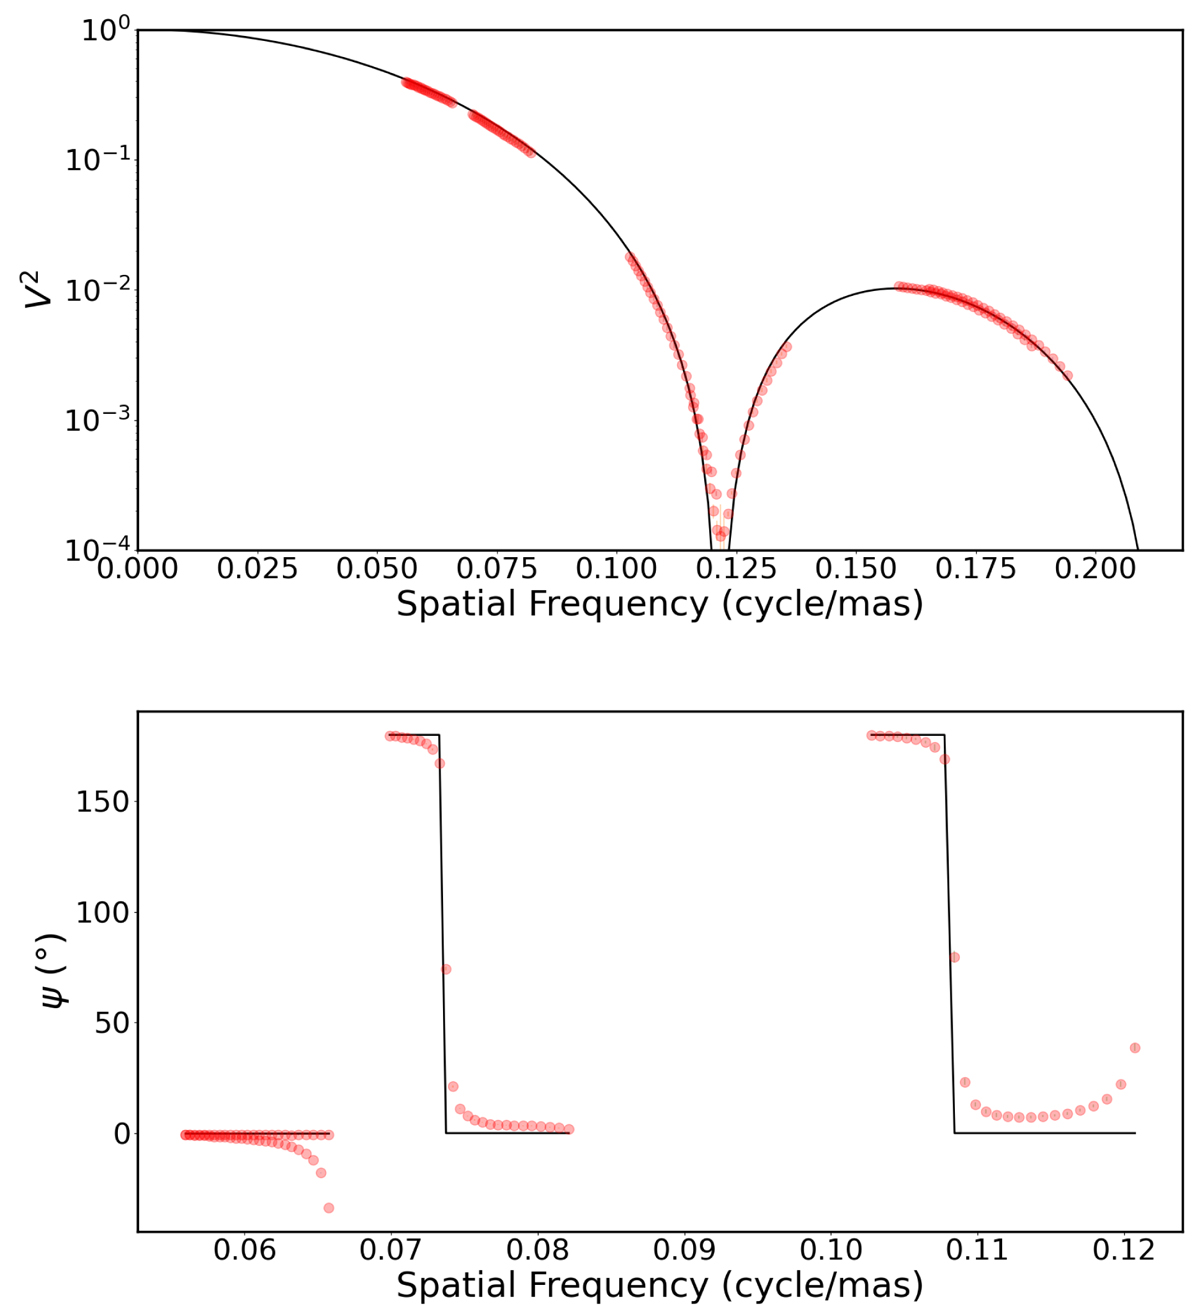
Observation of δ Vir in the L band. Top: measured squared visibilities (red) and limb-darkened model. Bottom: measured closure phases (red) and limb-darkened model. For the closure phase, the spatial frequency corresponds to the longest baseline of the triplet.
Current usage metrics show cumulative count of Article Views (full-text article views including HTML views, PDF and ePub downloads, according to the available data) and Abstracts Views on Vision4Press platform.
Data correspond to usage on the plateform after 2015. The current usage metrics is available 48-96 hours after online publication and is updated daily on week days.
Initial download of the metrics may take a while.