Fig. 24.
Download original image
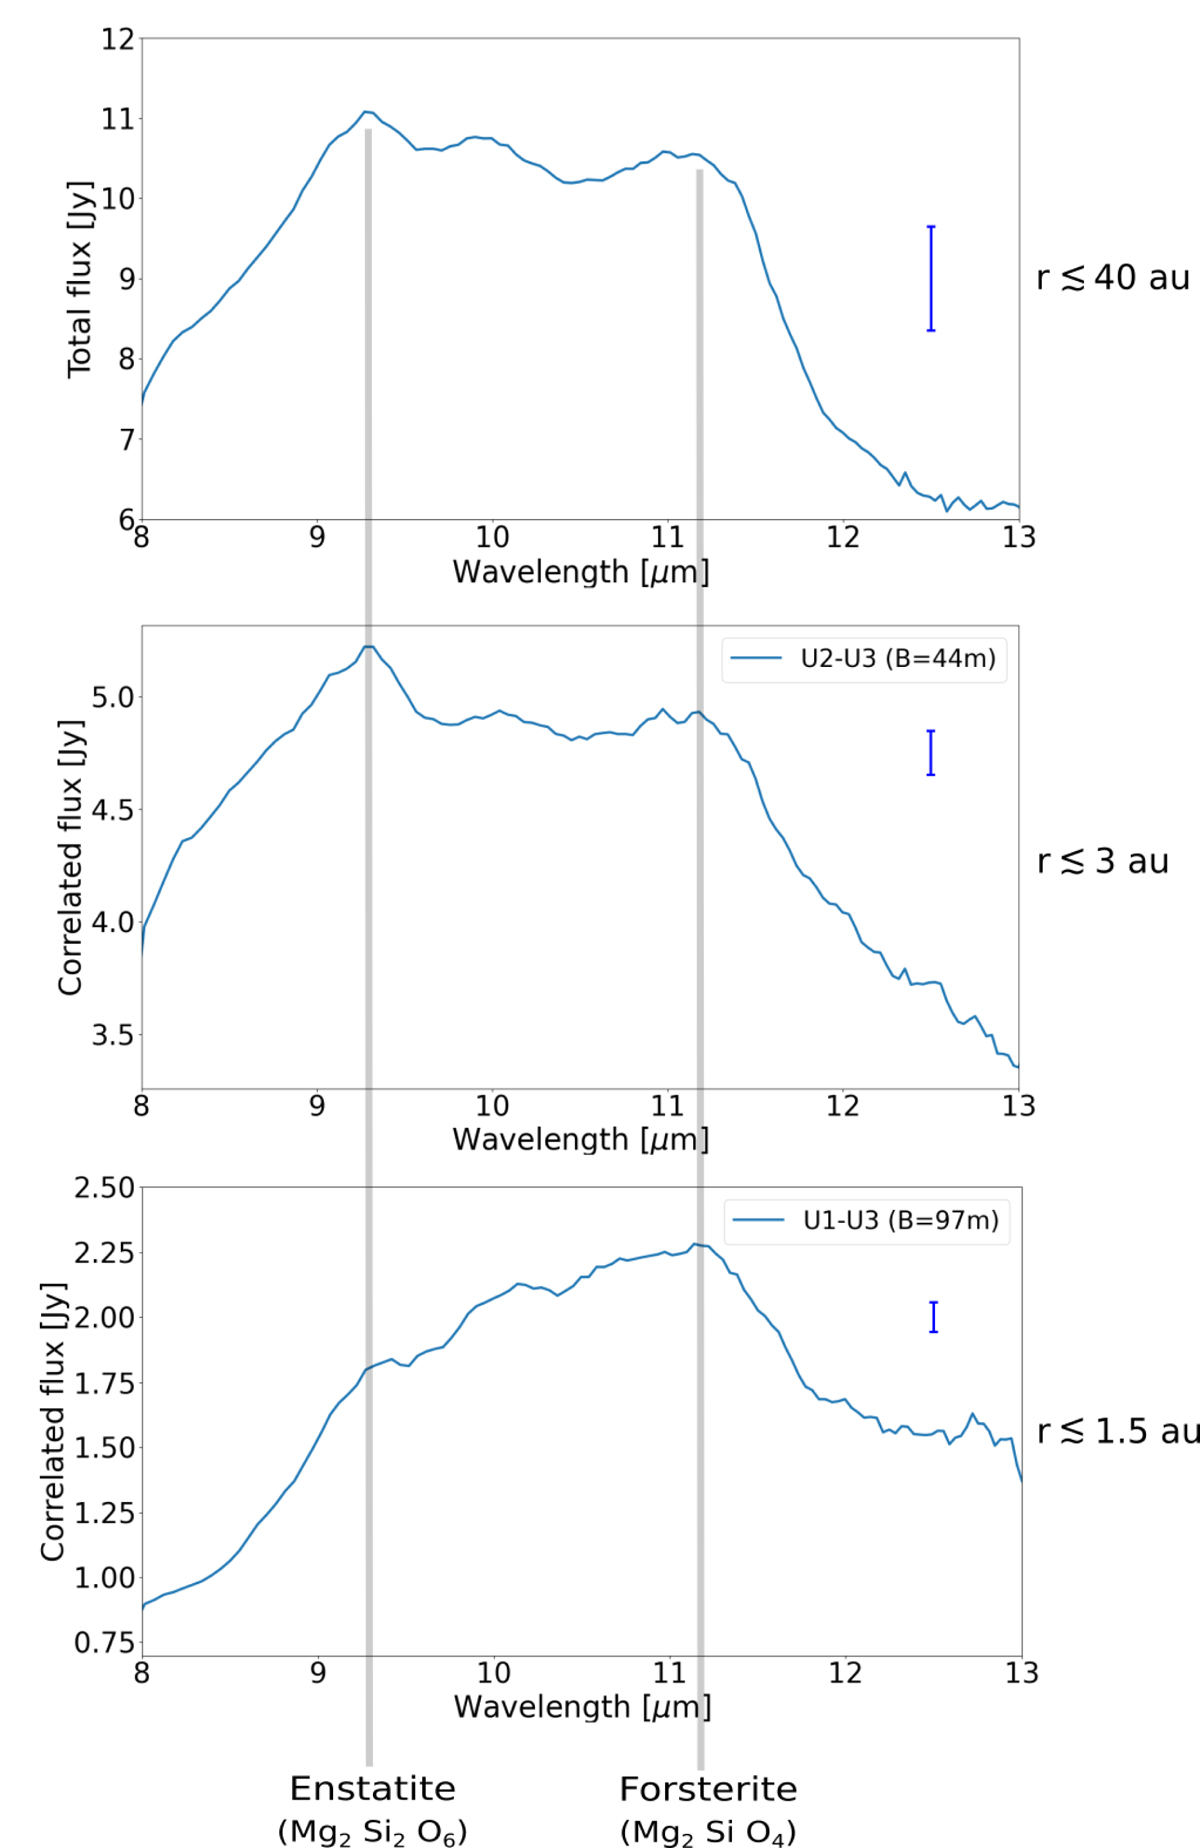
Left, from top to bottom: low-resolution (R = 30) N band total spectrum and correlated spectra of the Herbig Ae star HD 142527 obtained with MATISSE. The two correlated spectra shown here correspond to increasing baseline lengths (B = 44m and B = 97m). The disk region probed by the different spectra is indicated for each panel. The uncertainties affecting the measured spectra are indicated by the single error bars in the top right-hand corner of each plot.
Current usage metrics show cumulative count of Article Views (full-text article views including HTML views, PDF and ePub downloads, according to the available data) and Abstracts Views on Vision4Press platform.
Data correspond to usage on the plateform after 2015. The current usage metrics is available 48-96 hours after online publication and is updated daily on week days.
Initial download of the metrics may take a while.