Fig. 22.
Download original image
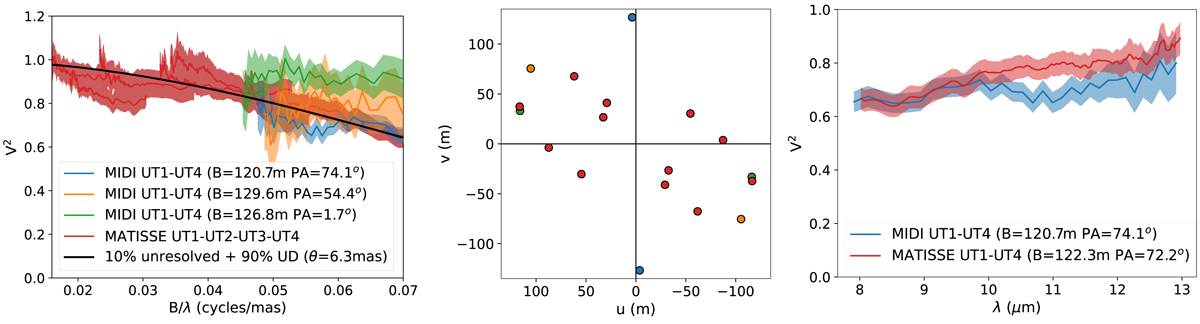
Comparison between MATISSE N band and MIDI data obtained on the classical Be star α Arae using the UTs. Left: all data plotted as a function of the spatial frequency with a best unresolved + uniform disk model. Centre: corresponding uv plane coverage with the same colours for MIDI and MATISSE observations. Right: data plotted as a function of the wavelength for two similar baselines in terms of length and orientation.
Current usage metrics show cumulative count of Article Views (full-text article views including HTML views, PDF and ePub downloads, according to the available data) and Abstracts Views on Vision4Press platform.
Data correspond to usage on the plateform after 2015. The current usage metrics is available 48-96 hours after online publication and is updated daily on week days.
Initial download of the metrics may take a while.