Fig. 21.
Download original image
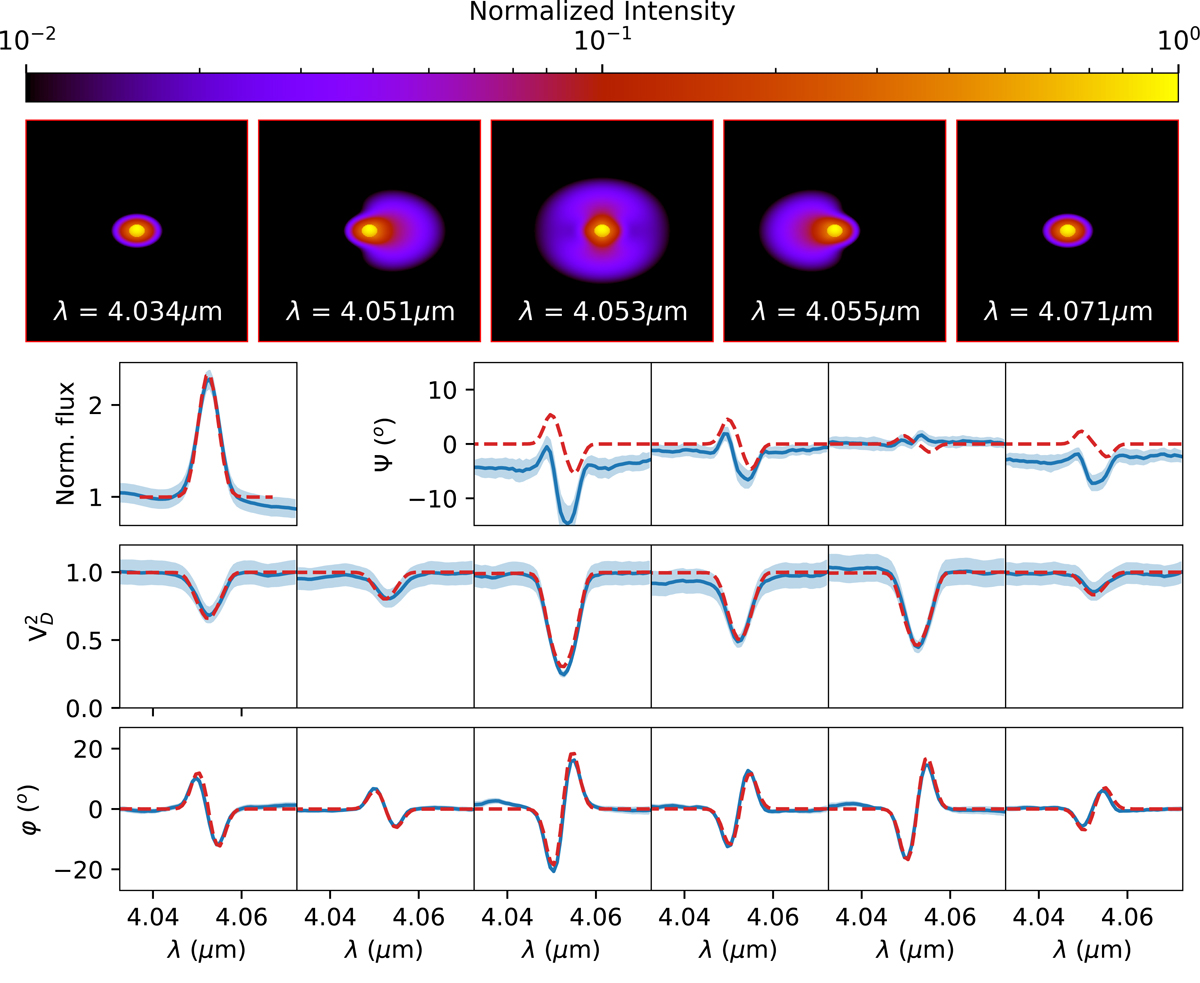
MATISSE high spectral resolution (R ∼ 1000) observation of the Be star α Arae. Comparison of the observation in the 4.053 μm Brα emission line (solid blue line) with the best-fit of a rotating disk toy model (red dashed line). Top: images of the toy model at different wavelengths in the continuum and through the line. Bottom: all observable quantities from a single MATISSE observation, including the normalised spectrum, the four closure phases, the six squared visibilities, and the six differential phases.
Current usage metrics show cumulative count of Article Views (full-text article views including HTML views, PDF and ePub downloads, according to the available data) and Abstracts Views on Vision4Press platform.
Data correspond to usage on the plateform after 2015. The current usage metrics is available 48-96 hours after online publication and is updated daily on week days.
Initial download of the metrics may take a while.