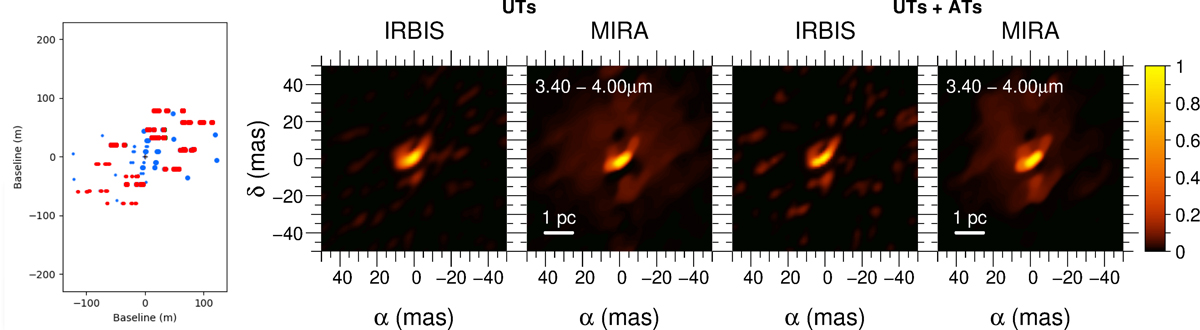
Fig. 20.
Download original image
NGC 1068 and the advantage for the image restoration of combining low frequency AT data with UT data. Left image: u–v coverage, with the AT baselines as blue dots, and the UT baselines are represented as red dots. Two left images: reconstructions are with UT baselines only, while the two right ones combine the baselines of UTs and ATs. The IRBis images are grey reconstructions over the 3.4–4.0 μm interval. The MIRA images are medians of all the 0.1 μm obtained between 3.4 and 4.0 μm.
Current usage metrics show cumulative count of Article Views (full-text article views including HTML views, PDF and ePub downloads, according to the available data) and Abstracts Views on Vision4Press platform.
Data correspond to usage on the plateform after 2015. The current usage metrics is available 48-96 hours after online publication and is updated daily on week days.
Initial download of the metrics may take a while.