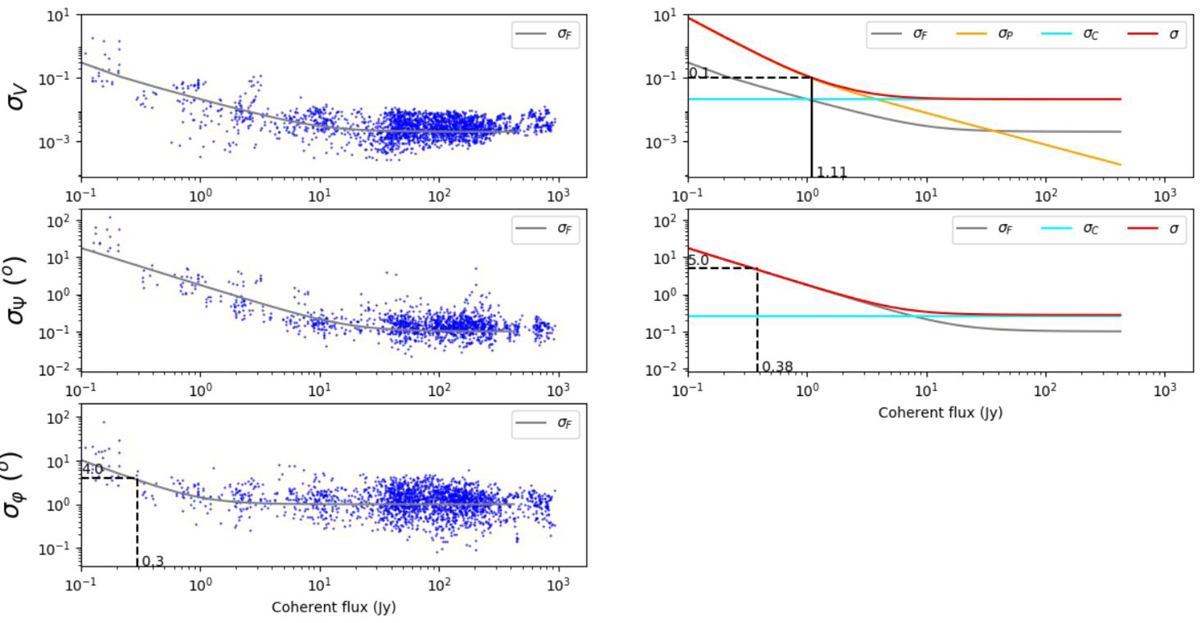
Fig. 16.
Download original image
Illustration of the general estimation of MATISSE precision and accuracy. Here we show the low-resolution setup in the L band with ATs. Left column: we plot the measured fundamental noise per spectral channel (blue dots) as a function of the source coherent flux. The grey line shows the value of the tuned noise prediction that goes through the median of the measures. Visibility on top in visibility units, closure phase in the middle and differential phase on bottom, in degrees. The coherent flux is in Jy. Top right panel: visibility fundamental noise standard deviation (grey), the flux dependent broad band photometric error (yellow) and the broad band calibration error due to seeing changes that is independent from the flux (cyan) as well as their combination (red) assuming these are independent variables.
Current usage metrics show cumulative count of Article Views (full-text article views including HTML views, PDF and ePub downloads, according to the available data) and Abstracts Views on Vision4Press platform.
Data correspond to usage on the plateform after 2015. The current usage metrics is available 48-96 hours after online publication and is updated daily on week days.
Initial download of the metrics may take a while.