Fig. 13.
Download original image
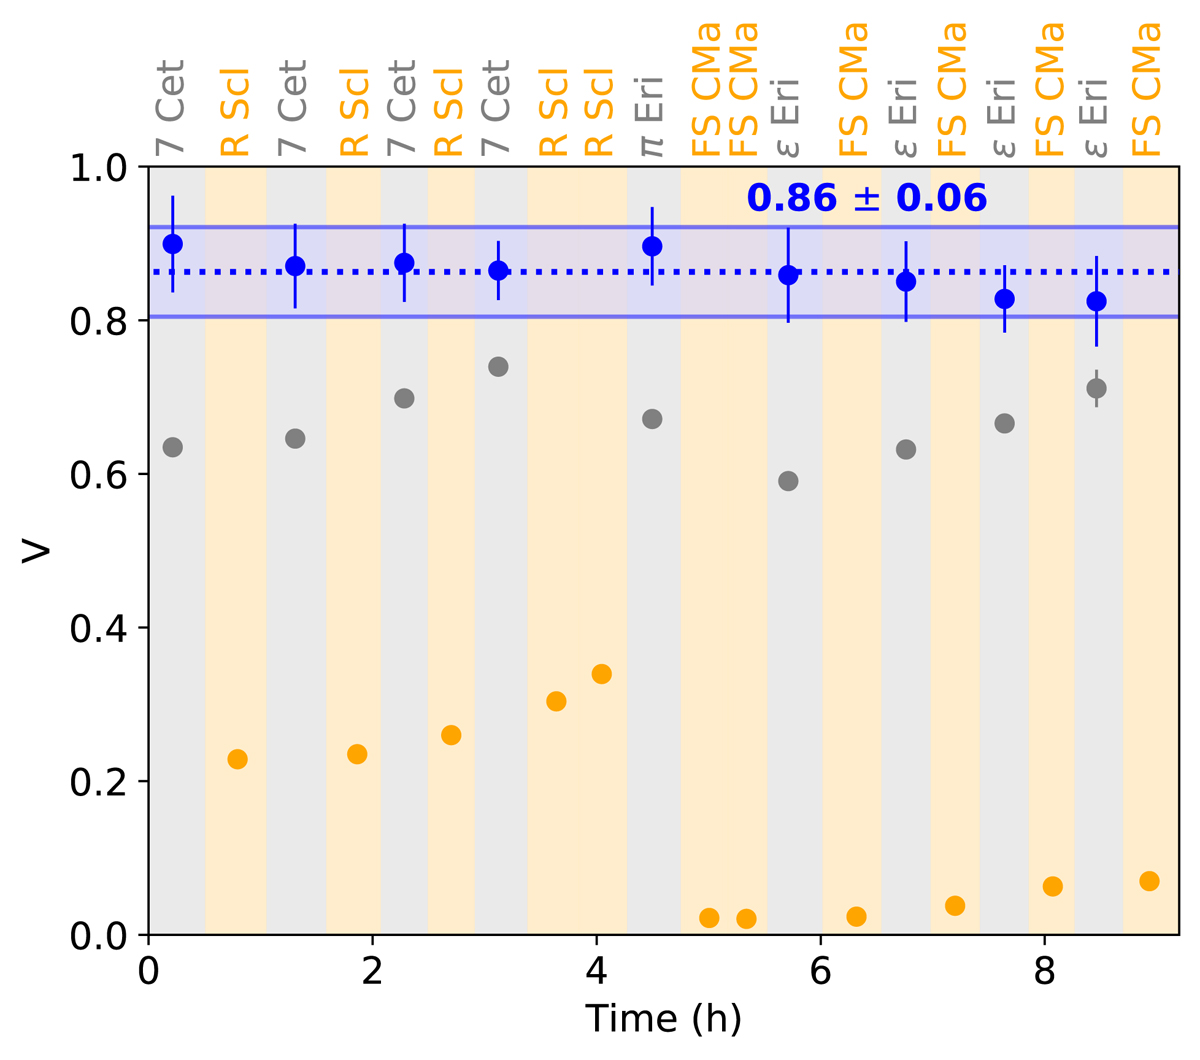
Mean L-band visibility (averaged between 3.1 and 3.8 μm) for the K0-G2 baseline plotted as a function of time for a full night on December 9, 2018. The science objects are shown in orange, and the calibrators are in grey. The estimated transfer function in visibility (i.e. corrected from the partial resolution of the calibrators) is shown in blue. The variation of the transfer function represented by the modulation of the blue dots is a slow temporal variation.
Current usage metrics show cumulative count of Article Views (full-text article views including HTML views, PDF and ePub downloads, according to the available data) and Abstracts Views on Vision4Press platform.
Data correspond to usage on the plateform after 2015. The current usage metrics is available 48-96 hours after online publication and is updated daily on week days.
Initial download of the metrics may take a while.